Now it's time to think about this paper
Acute Fructose Administration Decreases the Glycemic Response to an Oral Glucose Tolerance Test in Normal Adults
These are the results from an OGTT on a set of healthy human volunteers who took 75g of glucose with or without 7.5g of fructose. From the top graph you can see the results are more than a little inconclusive. If you instead plot change from baseline you get the slightly more convincing pair of curves below and if you compare the areas under the curves for the second plot you get p less than 0.05.

So fructose addition"almost" or "just" works. I think it was this set of findings which made Cherrington's group go for the canine study with a continuous duodenal infusion of glucose with or without extremely low dose fructose inclusion. So much more control and stability, over hours, than a 75g OGTT in a human where an awful lot of changes occur in the first 30 minutes.
Never the less some very interesting findings did come out of the human study.
As the authors noted, and published, some "normal" people have better OGTT results than others. And they also noted that, if you have a relatively poor OGTT result, you respond well to fructose. If you have a good OGTT result you don't respond to supplemental fructose at all. There is a correlation. It looks like this:

Okay, along the x axis we have a measure of how "good" an individual's OGTT result was. Low values are best, higher values are poorest. The
y axis indicates how much improvement in OGTT occurred with adding 10% fructose. There is a clear cut cluster at the left hand end. These individual people have the best normal OGTT results and do not respond to fructose supplementation, at all:

At the right hand area of the plot we have people who are trending towards impaired glucose tolerance by having a poor OGTT result and these clearly have a nice response to supplementary fructose:

We can then take those five people at the bottom left of the correlation plot and make a plot of their OGTT results with and without fructose and it comes out like this (using change from baseline glucose, not the absolute values, of course):

I think this is clear cut, if your OGTT only spikes your BG by 4.0mmol/l there is no benefit from adding fructose.
Next these are the six individuals for whom the straight glucose OGTT spiked their blood glucose by 5.0mmol/l:

Very clearly these six people benefit from added fructose.
If you have poor glucose tolerance you benefit from adding fructose. You become almost normal!
How come?

Insulin acts (among many other places) far, far away from the liver, on adipocytes to suppress lipolysis when there is a copious supply of glucose/insulin available. My definition of impaired glucose tolerance is the inability of adipocytes to limit their release of FFAs to the circulation under the influence of this insulin. In the above doodle insulin shuts down FFAs to 50micromol/l. That's normal. Now let's repeat this illustration with a residual supply of FFAs at around 200micromol/l under an OGTT.


I think the concept outlined makes sense and seems quite simple. Fructose feels like it is starting to yield some of its secrets.
Time to look at fructose and type 2 diabetes next.
Peter
You could, if you wanted, take a diagram like this
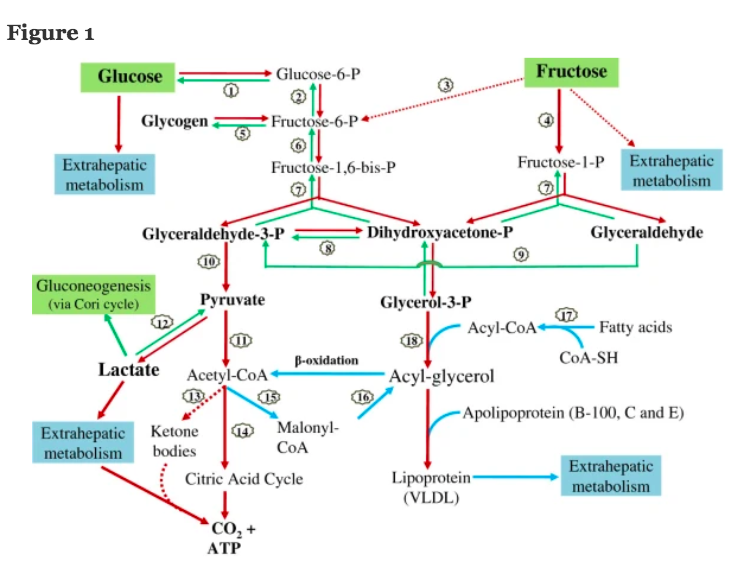
which I found in this comprehensive review:
(as a link kindly supplied by Jaromir in previous comments.) and try to work out exactly what nudging 75g of glucose metabolism by the co-adminstration of 7.5g of fructose might do to OGTT results in a real live human being. Sadly this is utterly beyond my abilities so I have to fall back on my own trusty crutch, the very simple ideas of ROS and what is meant by impaired glucose tolerance.
The last post was a summary of what I think the role of ROS from differing sources have on insulin signalling. In particular this concept matters:

Insulin acts (among many other places) far, far away from the liver, on adipocytes to suppress lipolysis when there is a copious supply of glucose/insulin available. My definition of impaired glucose tolerance is the inability of adipocytes to limit their release of FFAs to the circulation under the influence of this insulin. In the above doodle insulin shuts down FFAs to 50micromol/l. That's normal. Now let's repeat this illustration with a residual supply of FFAs at around 200micromol/l under an OGTT.

Insulin still docks with the insulin receptor, NOX4 still produces activating ROS but mitochondrial FFA oxidation is producing some degree of partial blockade of the insulin cascade at the insulin receptor substrate level:

The solution to this problem is simple, hyperinsulinaemia. This will not reduce the FFA levels from high basal lipolysis but will allow a "forced" increase in activating ROS and so increase phosphatase inhibition and so increase the insulin cascade to overcome the partial "obstruction" at the IRS level, like this:

Let's be absolutely clear. The hyperinsulinaemia is a sticking plaster placed on to the excess basal lipolysis secondary to adipocyte distension (linoleic acid derived). It is NOT a cure, it's a bodge.
The above is what I consider the metabolic explanation of people with poor glucose tolerance under an ordinary OGTT. The message is that the hyperinsulinaemia is just a tool to increase NOX4 derived ROS to a high enough level to allow the cell to overcome the inhibitory effect of excess FFA oxidation which should not be there.
The extra ROS are what makes this happens and the cost is hyperinsulinaemia.
Now lets add in some fructose.
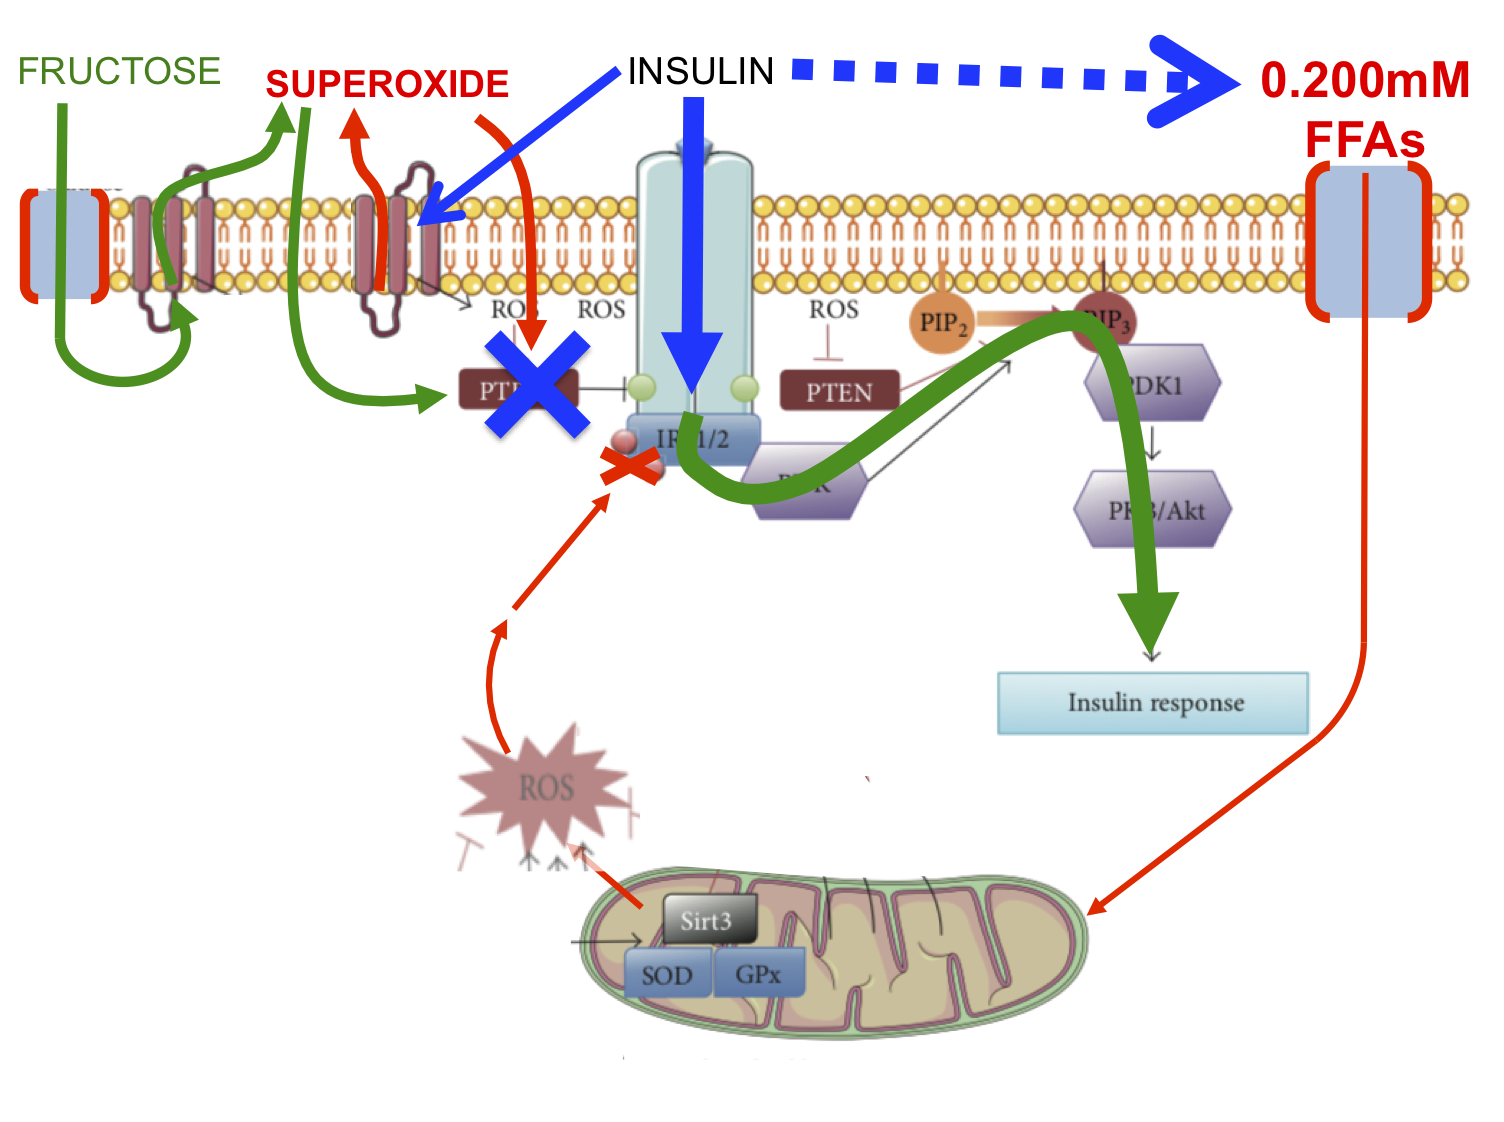
The fructose (all in green) enters the cell rapidly and talks to its own NOX enzyme generating its own extracellular superoxide. This dismutates and re enters the cell at the location where ROS are used to activate insulin signalling by disabling inhibitory phosphatases. So fructose derived ROS accentuate the insulin cascade to restore insulin signalling, much as hyperinsulinaemia would do, but without the hyperinsulinaemia.
Again, the signal is the ROS.
Again, it's not a cure, it's a sticking plaster. We are simply using an alternative source of supplementary ROS to activate the insulin cascade. I've changed this last feature to green as well, just to signify it's being helped by fructose derived ROS. I don't mean to suggest this is fructose catabolism, just fructose-ROS facilitated pAKT activation et sequitur.
Activating the insulin cascade in hepatocytes without any action anywhere else will lower glucose penetration to the systemic circulation and normalise the OGTT result.
Recall there is a specific problem causing the poor OGTT result and we have not fixed this problem. Things look better but the abnormal basal lipolysis derived FFAs are still there.
In people with an excellent OGTT result the insulin cascade pretty well fully activates and adding a few extra ROS seems to make little difference in this model. Of course we know that there are changes in the liver of very normal individuals secondary to low dose fructose because we already know the results of the subsequent canine studies.
However two of the normal people had a worsening of their OGTT area under the curve, one by quite a lot, clearly visible circled in red here on the correlation graph:

These two individuals had an excellent OGTT without fructose so we can assume they are perfectly capable of suppressing adipose lipolysis to levels which don't interfere with insulin signalling. You have to ask yourself if it is possible that the ROS generated by fructose and its NOX were sufficiently numerous that they diffused as far inwards from the cell surface as to start to act on the insulin receptor substrate in a mild version of the marked inhibitory effect of FFA oxidation derived ROS. I've put this speculation in as a dotted green line and reduced the overall insulin cascade curving arrow to show some limitation of downstream signalling:

When we come to think about grossly toxic doses of fructose this generation of impaired insulin signalling is likely to be come a primary feature. Perhaps we have a hint here. Just guessing.
We are not given enough individual subject level data to see what happened to any parameter other than glucose in this study. We only get the whole group aggregate data for most parameters.
I think the concept outlined makes sense and seems quite simple. Fructose feels like it is starting to yield some of its secrets.
Time to look at fructose and type 2 diabetes next.
Peter
