Showing posts sorted by relevance for query glucose tolerance. Sort by date Show all posts

Monday, April 24, 2023

Fructose (04) Normal Adults

Now it's time to think about this paper
These are the results from an OGTT on a set of healthy human volunteers who took 75g of glucose with or without 7.5g of fructose. From the top graph you can see the results are more than a little inconclusive. If you instead plot change from baseline you get the slightly more convincing pair of curves below and if you compare the areas under the curves for the second plot you get p less than 0.05.


So fructose addition"almost" or "just" works. I think it was this set of findings which made Cherrington's group go for the canine study with a continuous duodenal infusion of glucose with or without extremely low dose fructose inclusion. So much more control and stability, over hours, than a 75g OGTT in a human where an awful lot of changes occur in the first 30 minutes.

Never the less some very interesting findings did come out of the human study.

As the authors noted, and published, some "normal" people have better OGTT results than others. And they also noted that, if you have a relatively poor OGTT result, you respond well to fructose. If you have a good OGTT result you don't respond to supplemental fructose at all. There is a correlation. It looks like this:


Okay, along the x axis we have a measure of how "good" an individual's OGTT result was. Low values are best, higher values are poorest. The 
y axis indicates how much improvement in OGTT occurred with adding 10% fructose. There is a clear cut cluster at the left hand end. These individual people have the best normal OGTT results and do not respond to fructose supplementation, at all:


At the right hand area of the plot we have people who are trending towards impaired glucose tolerance by having a poor OGTT result and these clearly have a nice response to supplementary fructose:


We can then take those five people at the bottom left of the correlation plot and make a plot of their OGTT results with and without fructose and it comes out like this (using change from baseline glucose, not the absolute values, of course):


I think this is clear cut, if your OGTT only spikes your BG by 4.0mmol/l there is no benefit from adding fructose.

Next these are the six individuals for whom the straight glucose OGTT spiked their blood glucose by 5.0mmol/l:


Very clearly these six people benefit from added fructose.

If you have poor glucose tolerance you benefit from adding fructose. You become almost normal!

How come?

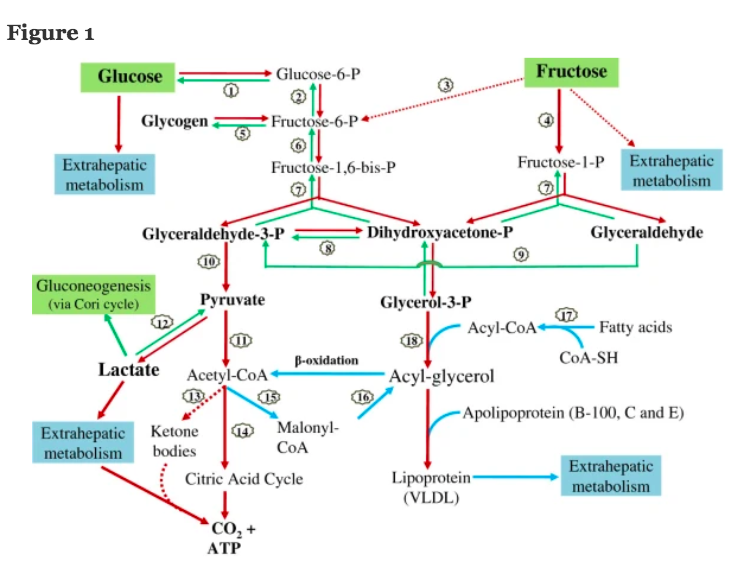
You could, if you wanted, take a diagram like this


which I found in this comprehensive review:

(as a link kindly supplied by Jaromir in previous comments.) and try to work out exactly what nudging 75g of glucose metabolism by the co-adminstration of 7.5g of fructose might do to OGTT results in a real live human being. Sadly this is utterly beyond my abilities so I have to fall back on my own trusty crutch, the very simple ideas of ROS and what is meant by impaired glucose tolerance.

The last post was a summary of what I think the role of ROS from differing sources have on insulin signalling. In particular this concept matters:


Insulin acts (among many other places) far, far away from the liver, on adipocytes to suppress lipolysis when there is a copious supply of glucose/insulin available. My definition of impaired glucose tolerance is the inability of adipocytes to limit their release of FFAs to the circulation under the influence of this insulin. In the above doodle insulin shuts down FFAs to 50micromol/l. That's normal. Now let's repeat this illustration with a residual supply of FFAs at around 200micromol/l under an OGTT.


Insulin still docks with the insulin receptor, NOX4 still produces activating ROS but mitochondrial FFA oxidation is producing some degree of partial blockade of the insulin cascade at the insulin receptor substrate level:


The solution to this problem is simple, hyperinsulinaemia. This will not reduce the FFA levels from high basal lipolysis but will allow a "forced" increase in activating ROS and so increase phosphatase inhibition and so increase the insulin cascade to overcome the partial "obstruction" at the IRS level, like this:


Let's be absolutely clear. The hyperinsulinaemia is a sticking plaster placed on to the excess basal lipolysis secondary to adipocyte distension (linoleic acid derived). It is NOT a cure, it's a bodge.

The above is what I consider the metabolic explanation of people with poor glucose tolerance under an ordinary OGTT. The message is that the hyperinsulinaemia is just a tool to increase NOX4 derived ROS to a high enough level to allow the cell to overcome the inhibitory effect of excess FFA oxidation which should not be there.

The extra ROS are what makes this happens and the cost is hyperinsulinaemia.

Now lets add in some fructose.
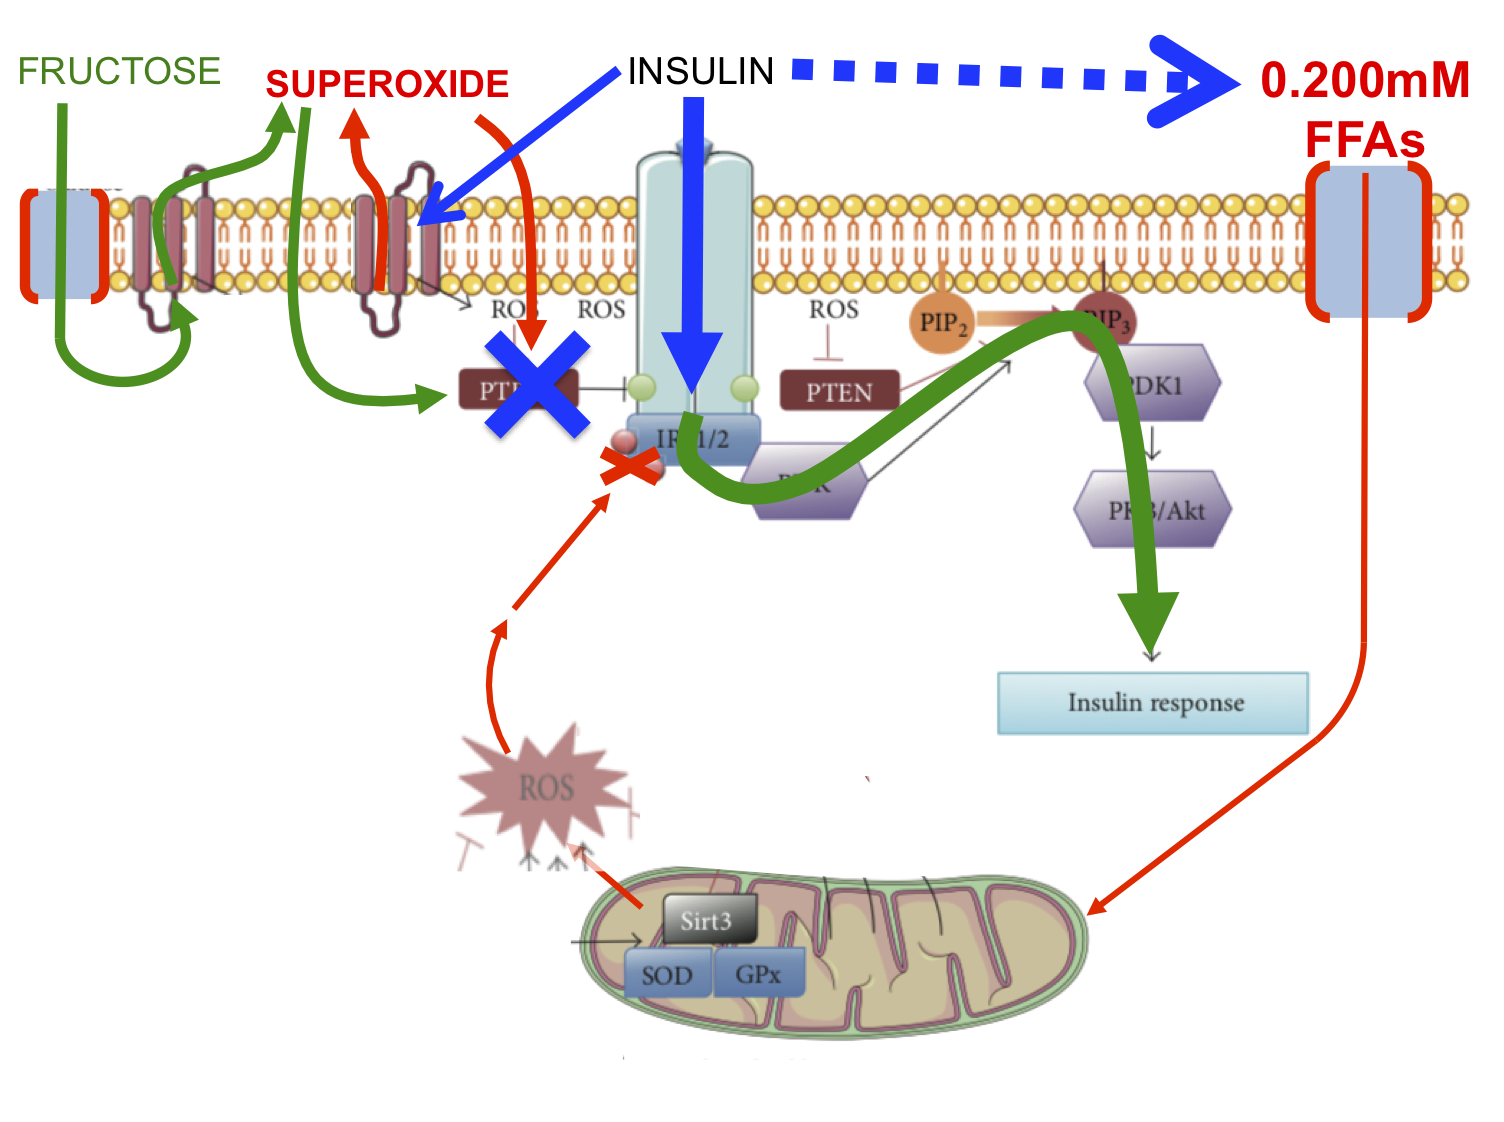


The fructose (all in green) enters the cell rapidly and talks to its own NOX enzyme generating its own extracellular superoxide.  This dismutates and re enters the cell at the location where ROS are used to activate insulin signalling by disabling inhibitory phosphatases. So fructose derived ROS accentuate the insulin cascade to restore insulin signalling, much as hyperinsulinaemia would do, but without the hyperinsulinaemia.

Again, the signal is the ROS.

Again, it's not a cure, it's a sticking plaster. We are simply using an alternative source of supplementary ROS to activate the insulin cascade. I've changed this last feature to green as well, just to signify it's being helped by fructose derived ROS. I don't mean to suggest this is fructose catabolism, just fructose-ROS facilitated pAKT activation et sequitur.

Activating the insulin cascade in hepatocytes without any action anywhere else will lower glucose penetration to the systemic circulation and normalise the OGTT result.

Recall there is a specific problem causing the poor OGTT result and we have not fixed this problem. Things look better but the abnormal basal lipolysis derived FFAs are still there.

In people with an excellent OGTT result the insulin cascade pretty well fully activates and adding a few extra ROS seems to make little difference in this model. Of course we know that there are changes in the liver of very normal individuals secondary to low dose fructose because we already know the results of the subsequent canine studies.

However two of the normal people had a worsening of their OGTT area under the curve, one by quite a lot, clearly visible circled in red here on the correlation graph:


These two individuals had an excellent OGTT without fructose so we can assume they are perfectly capable of suppressing adipose lipolysis to levels which don't interfere with insulin signalling. You have to ask yourself if it is possible that the ROS generated by fructose and its NOX were sufficiently numerous that they diffused as far inwards from the cell surface as to start to act on the insulin receptor substrate in a mild version of the marked inhibitory effect of FFA oxidation derived ROS. I've put this speculation in as a dotted green line and reduced the overall insulin cascade curving arrow to show some limitation of downstream signalling:


When we come to think about grossly toxic doses of fructose this generation of impaired insulin signalling is likely to be come a primary feature. Perhaps we have a hint here. Just guessing. 

We are not given enough individual subject level data to see what happened to any parameter other than glucose in this study. We only get the whole group aggregate data for most parameters.

I think the concept outlined makes sense and seems quite simple. Fructose feels like it is starting to yield some of its secrets.

Time to look at fructose and type 2 diabetes next.

Peter

Saturday, April 01, 2023

Metformin (14) Normals

One of the flakiest aspects of Protons is the concept that the glycerophosphate shuttle transforms cytoplasmic NADH in to a mitochondrial FADH2 input, altering the FADH2:NADH ratio in a direction which favours reverse electron transport through complex I, given a reduced CoQ couple, and this leads to a) continued ROS generation to maintain insulin signalling and b) easy achievement of high ROS once a cell is replete with calories, ie when it is then necessary to resist further insulin mediated calorie ingress.

So the glycerophosphate shuttle should mediate both insulin signalling and insulin resistance, essentially controlled by the redox state of the CoQ couple. If CoQH2:CoQ is moderate ROS are still adequate to activate insulin signalling, if CoQH2:CoQ ratio is high ROS will also be high and insulin signalling will be curtailed.

Metformin blunts insulin signalling, in addition to reducing hepatic glucose output, by blockade of the glycerophosphate shuttle at mtG3Pdh.

Finding evidence to confirm this bias is not easy. I hope we all recall the poor Polish girl with SHORT syndrome who fell in to the hands of the endocrinologists who "treated" her insulin "resistance" with metformin. That ended well...

Metformin (11) a SHORT paradox

However, I tripped over this next paper while looking for something else. Oddly enough when I saved it it turned out I had already got a copy and had put up a one liner post about it

Metformin (12) You don't need to be SHORT

but didn't explain its significance. Here's the paper:

and here we go as to why I like it.

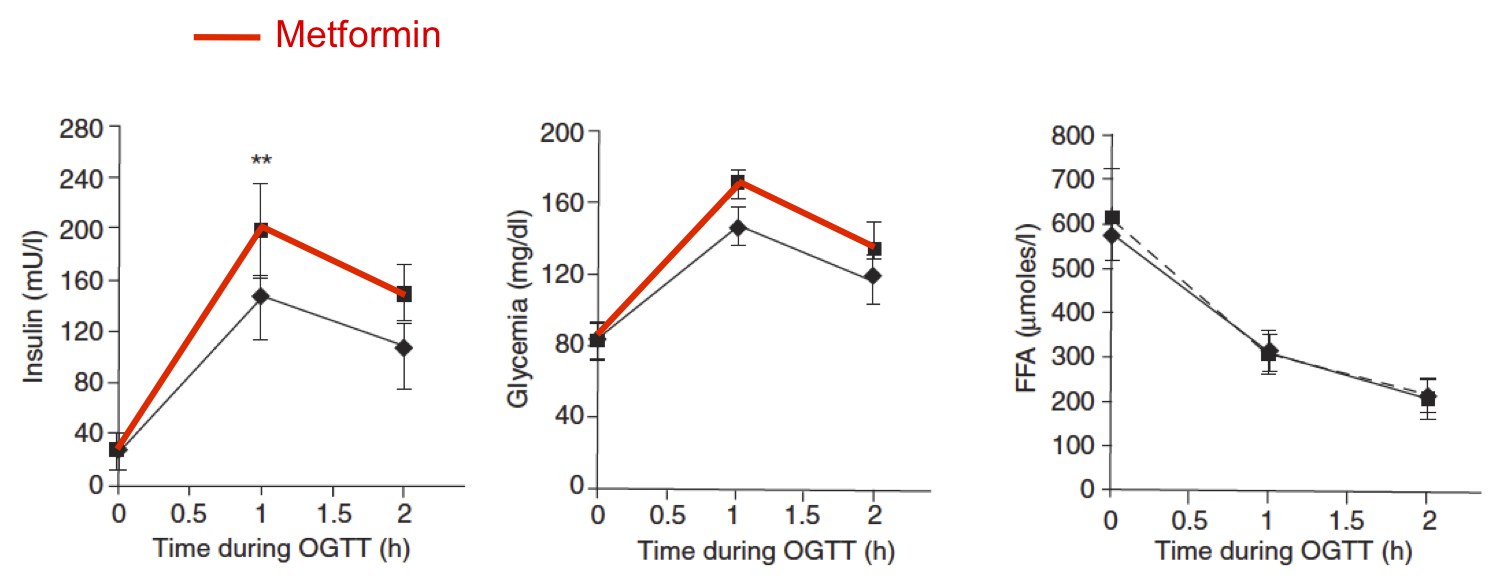
These are the results of treating either DMT2 people or people with a family history of DMT2 using metformin. There is an almost infinite supply of such responses in Pubmed, metformin is clearly insulin sensitising. If you wanted to you could say that metformin reduces insulin resistance. And then blanche at the thought of trying to define exactly what you mean by "insulin resistance".


I guess the first small fly in the ointment is the fasting FFAs,  as I've highlighted here


It looks like the rise in FFAs was not statistically significant but it must have come damned close. Increased insulin sensitivity should suppress FFAs.

So if we consider the insulin and glucose responses to be a direct result of suppressed gluconeogenesis in the liver and subsequent decreased hepatic glucose output then the rise in FFAs becomes as simple as being a direct consequence of metformin decreasing insulin signalling in adipocytes via blockade of mtG3Pdh plus a decreased absolute level insulin per se due to reduced hepatic glucose output. From my point of view all the adipocytes "see" is less  absolute insulin plus less ROS generated via the glycerophosphate shuttle, so less insulin signalling. They release FFAs.

If we then look at an obese person who is still insulin sensitive they have no fasting hyperglycaemia and no fasting hyperinsulinaemia.


Giving metformin for 10 days has essentially no effect on fasting insulin or glucose. Gluconeogenesis will still be reduced by metformin but the accompanying blunting of hepatic insulin signalling (via blockade of mtG3Pdh) allows more glucose release, so the two roughly balance out. This may not be the case under peak metformin effect, diabetic rats do drop their blood glucose on an IV dose of metformin at a therapeutic level of hepatic glucose output suppression. This may well be dependent of how much metformin you give, by which route and at which time you measure. Fed vs fasted would matter as well.

On feeding 75g of glucose to normal people for an OGTT insulin signalling becomes important and the decreased insulin signalling intrinsic to metformin shows as mildly impaired glucose tolerance (statistically ns but clinically 130mg/dl vs 170mg/dl might be undesirable) but because of blunted insulin signalling a significant compensatory hyperinsulinaemia is needed to get even this rather impaired glucose response.

So. In insulin sensitive people metformin's easily comprehensible action to obtund insulin signalling shows, under high glucose and high insulin conditions, as an impaired glucose tolerance with compensatory hyperinsulinaemia.

With supra-maximal dietary glucose (the specific intention in an OGTT is maximal activation of the insulin system) suppression of hepatic glucose output becomes irrelevant and all we see is mtG3Pdh inhibition manifest as poor insulin signalling. As it did for the poor girl with SHORT syndrome.

Nice.

I'm now wondering if there is any logical way of working out why people with DMT2 almost always (and clearly unexpectedly) benefit from metformin, while people with simple obesity behave exactly as you would expect them to do under an insulin signal blunting agent, especially during an OGTT.

It might be possible. I'm thinking about it.

Peter

Wednesday, February 08, 2017

Acipimox (2) and weight gain

*****************************************************************
TLDR: Forced lipolysis gives weight loss and elevates FFAs which cause insulin resistance. Forced adipocyte distension causes obesity with secondary FFA release causing even worse insulin resistance.
*****************************************************************


Well, I got a full text copy (thanks again to Mike Eades) of the acipimox in mice under intermittent hypoxia study. It's a very strange paper. But it has some aspects which I find interesting.

They took groups of mice and kept them in a chamber for two weeks which either exposed them to severe intermittent hypoxia or no intermittent hypoxia. With or without acipimox.

Intermittent hypoxia induces weight loss mediated via the sympathoadrenal system. The mice started at 24.8g and ended up two weeks later at 22.6g. The increased lipolysis elevated free fatty acids and impaired glucose tolerance. These are the intra peritoneal GTT results:


This is pretty simple and is exactly what you might expect. The AUC for the control group (black circles) is 18.2 mg/dl/120 min x 10^3.

If you do exactly the same thing but add acipimox to the drinking water you get this:


These mice (still black circles) lived in the same apparatus, were never exposed to IH but did drink acipimox for two weeks. These mice have become profoundly glucose intolerant, AUC is 26.9 mg/dl/120 min x 10^3. This is very glucose intolerant. Even the IH mice (open circles) only made an AUC of 24.2 mg/dl/120 min x 10^3.

I have no idea what happened to their weight because the paper doesn't say.

There is a suggestion, from the discussion, that they gained weight, possibly a lot of weight:

"Consequently, acipimox-treated mice presented with higher body weight and larger adipocyte size compared with vehicle-treated groups at the end of exposures. Because metabolic parameters in mice are strongly determined by body weight (22) and adipocyte size (23), anthropometric differences between acipimox- and vehicle-treated groups might explain higher spontaneous lipolytic rates and higher fasting glucose levels in acipimox-treated versus vehicle-treated control groups" [and extreme glucose intolerance]. My addendum.

But you're not getting the weights. I am suspicious that the weight gains were such that stating them would have demanded a discussion of exactly why they occurred.

So a combination of being in the apparatus and drinking acipimox made the mice fat enough to mangle their glucose tolerance.

Impressive.

The group also treated a set of mice with acipimox without putting them in the apparatus. Just left them in routine cages with or without acipimox. No problems with weight gain or glucose tolerance.

Hmmmmmmm....

BTW Just for fun here is the effect of injecting exogenous insulin in to those fat mice after two weeks on acipimox under control chamber conditions. Insulin does nothing. I think very insulin resistant is a reasonable description. It's the black circles you need to look at:


So what can you take away from the paper? They have a quirky finding. A "That's odd" moment. A bit like Sauer finding that putting a rat in to starvation allows its xenografted cancer to grow like wildfire. But, unlike Sauer, they've just stepped round it and pretended it was unimportant.

Their core finding, that inappropriately elevated free fatty acids (especially after acipimox) trigger glucose intolerance and insulin resistance, strikes me as very important. Lowering FFA with acipimox acutely (1-2 days) goes a long way to ameliorating metabolic syndrome (acutely), lots of studies on this. There is a significant role for FFAs in metabolic syndrome, largely related to adipocyte distention/dysfunction. It's not all of metabolic syndrome, but a big chunk.

So from here I wandered around other triggers for elevated FFAs.

Peter

Late additional thought: IH mice are thin and have elevated FFAs due to sympathetic nervous system activation. Their adipocytes are half empty, like a human on amphetamines or crystal meth. Given enough insulin there is room in the adipocytes to cram some more fat in, where it will stay until the next meth hit. So they can respond to a GTT. Acipimox treated mice have overstuffed adipocytes, that's why FFAs are elevated rather than due to stimulated lipolysis. Trying to cram more fat (with glucose for the glycerol) in to these adipocytes is almost impossible, a situation worse than that with those half empty adipocytes after IH or crystal meth exposure.

Sunday, March 11, 2018

On phosphorylating AKT: the penultimate half post

I'm going to use some of Konrad's data to try and understand Kahn's data and the see if it will extrapolate to growth hormone receptor knockout (GHrKO) adipoctes. That's the plan. Time will tell... I'm going to use the term eWAT for epididymal adipose tissue.

There are three curves here from Konrad.


The open circles are mice with extra eWAT carefully added to a mesenteric (liver draining) site only. The eWAT is inflamed, leaking IL-6 and this goes directly to the liver. This IL-6 is causing hepatic insulin resistance with glucose intolerance, as per the last post. There is no elevation of portal FFAs after a three hour fast (not surprising when you recall that you need seriously low insulin levels to access visceral fat, three hours won't hack it). So we can ignore the open circles.

The black circles are the controls.

The grey circles are mice with eWAT (this is normal eWAT from normal sacrificed Bl/6 mice) added to the peritoneum with all of its venous drainage going to the systemic circulation. This too is leaking IL-6 but by the time it's diluted throughout the whole systemic circulation it causes no insulin resistance. Result: adding eWAT without hitting the liver with IL-6 simply provides extra adipocytes, they accept glucose, glucose tolerance test results improve. This is a generic effect of adding extra adipose tissue, it doesn't seem to matter what the source of adipose tissue is or where you put it, so long as it isn't trickling IL-6 in to the liver, any extra fat improves glucose tolerance. Think thiazolidines, more new fat cells, they're empty, glucose tolerance improves as the cells fill up.

Here is a graph from Kahn; the effect of extra fat, when it isn't dumping IL-6 directly to the liver, is always to improve insulin sensitivity, even adding eWAT to mesentery, here called VIS-VIS:


Clearly only subcuticular fat transplanted to the mesenteric site reaches statistical significant (SC-VIS). But you can see the trend...

This is the exact converse of the diabetes of lipodystrophy cases: in lipodydtrophy there is no adipose anywhere, nowhere to put glucose/fatty acids, all stored triglyceride is ectopic, so your end result is severe glucose intolerance.

Now to look at basal lipolysis from Masternak and Bartke's group. This is an in-vitro measurement, performed on aliquots of adipose tissue in Dulbecco’s modified Eagle medium with or without 10% FBS (foetal bovine serum) where they started looking at lipolysis from GHrKO adipocytes, harvested from congenitally Laron dwarf mice. I'm guessing the 10% FBS made no difference because this is the only figure we get in the supplemental data:


Now, you have to be very careful with this data. Basal lipolysis is not the same as lipolysis under fasting levels of insulin. Basal lipolysis would produce a ketoacidotic fatality because no insulin is obviously the equivalent of severe T1DM and is rapidly fatal without a very expensive trip to A and E (unless you have the NHS). Next we have the problem that this lipolysis measurement is made per gram of tissue, but in the whole animal some tissue depots are bigger than others as a % of bodyweight and all GHrKO mice are obese, so they have much more fat to provide FFAs per unit muscle etc. The approximate total fat mass of a GHrKO dwarf mouse is actually very similar to that of a normal Bl/6 mouse, it's only the fat free mass which is small. So glycerol release per gram of adipose tissue may be lower in the dwarf mice, but total lipolysis might be very similar to Bl/6 mice. Merely adding basal insulin would produce a normal, hungry mouse but we have no idea what the rates of lipolysis would be then and if they might change more in some tissues than others. So a little caution, to say the least, is needed.

With that said I was going to go on to say all sorts of things about lipolysis but at this point the penny dropped, as we say in the UK. I've stopped following the trail and I think I know why GHrKO mice are the longest living mice ever engineered. Perhaps I should put that in to a final post in the series.

Peter

Wednesday, April 26, 2023

Fructose (05) Four out of five diabetics

This follow on study looking at fructose in people with type 2 diabetes was a bit of a disappointment. 

TLDR: Fructose works pretty well in four out of five people with diabetes just as it does in "normal" people with a relatively poor OGTT result.

Acute Fructose Administration Improves Oral Glucose Tolerance in Adults With Type 2 Diabetes

This is what the title of the study is describing:


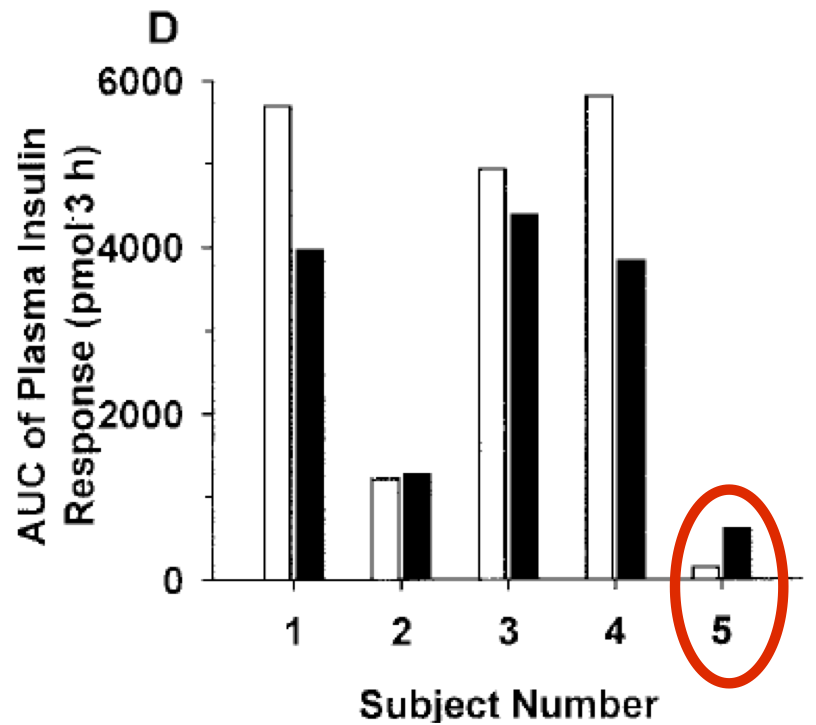
It's clear that adding 7.5g of fructose to a 75g OGTT load improved both glucose and insulin curves. There is nothing exciting about this. What I thought might be interesting was that, in a study of five subjects, two of them were outliers of sorts.

I'd hoped these outliers might give more insight in to the state of ROS signalling within hepatocytes of people with severe diabetes. Not really, much of the data you need is not in the paper. For completeness here are the anomalous results:

Subject 2 failed to drop their systemic glucose in response to added fructose, like this


Not unsurprisingly they also failed to drop their insulin level, clearly insulin level follows exposure of the pancreas to systemic glucose, which didn't change, so neither did insulin.

Can we guess what might have been happening in hepatocytes to nullify the "beneficial" effects of fructose? Let's assume that fructose is being absorbed, entering hepatocytes and generating ROS via a NOX enzyme in proportion to the rate of fructose ingress. So the question becomes

"Under what circumstances does a modest increase in ROS fail to activate the insulin cascade?"

We have no idea what the fasting insulin level was, nor the fasting glucose, so this is a little difficult. We are told that subject 2 had an HbA1c of 9.0 or 10.1, one of the highest in the study, which implies the worst average glucose excursion over the last three months or so. We could choose extreme insulin resistance, failing beta cell function or a combination of both to explain this. The fact that they produced a minimal increase in AUC for insulin when presented with 75g of glucose with or without fructose suggests that beta cell function was limited and underlying hyperglycaemia might both be present. I favour this explanation.

Both hyperinsulinaemia -> NOX4 activation via G protein coupled signalling and hyperglycaemia -> NOX2 activation via calmodulin kinase signalling have the potential to spill ROS over from activating via phosphatase inhibition to being inhibitory via insulin receptor substrate inhibition. Adding a small increase in ROS from fructose to a maximally stimulated system may affect both aspects, producing no net change. That's my guess.

The second unusual result was from subject 5. They produced a perfectly reasonable drop in systemic glucose in response to fructose addition but had an unusual increased insulin response despite reduced systemic glucose.


I struggle to explain this "paradoxical" rise in insulin despite a successful fructose induced fall in pancreatic exposure to systemic glucose. You could argue that the increase in insulin came first and this lowered the systemic glucose level but this would make quite an exception and need either a pancreatic response to a very small systemic fructose rise or a pancreatic effect derived from gut hormone signals, none of which were measured and none of which are needed for an explanation of the fructose effect in all other subjects.

If I had to guess I would suggest the fasting insulin level was very high in this person. We know from this 2011 study that OGTTs are reproducible on repeat testing (in "normal" people) over 3 days unless you have to be hyperinsulinaemic in order to be "normal":

Reproducibility of multiple repeated oral glucose tolerance tests

"However, our cases of individuals who exhibited hyperinsulinaemia in order to maintain glucose homeostasis, suggest that repeated OGTT’s may not produce a reliable estimation of insulin sensitivity for people with pre-diabetes and diabetes."

Subject 5 was also an individual with very high HbA1c (9.0 or 10.1) suggesting poor control and compatible with high insulin levels. So the insulin anomaly may just be random finding in one person secondary to chronic hyperinsulinaemia... We'll never know.


Overall the fructose effect on hepatic glucose output seems to be genuinely maintained in patients with DMT2 unless they are approaching seriously poor levels of control.

Should individuals with more "mild" diabetes add a little fructose to each bowl of porridge they consume in real life?

Rhetorical question.

Peter

Friday, March 16, 2018

On phosphorylating AKT in GHrKO Laron mice

OK. I started this whole adipocyte thread because I was interested in the longevity effect in the GHrKO mouse, the Laron mouse. These posts get written because I am compelled to, I have no choice in it. I never know where they are going to end up as they start. This one has involved a lot of looking at the various types of adipocytes and how they function in normal physiology and what happened when transplanted to more unusual places. Much of it makes sense, and it does put a very different perspective on the roles of visceral and subcutaneous adipose tissue. What I was looking for was what might be special about Laron dwarf mouse derived adipocytes. You can't quite find all of the answers you want to because not all of the questions have really been asked directly, but I think you can get close. I think this is going to be the last post in the series, a relief to me, and possibly to readers too.

Laron mice (GHrKO) are the longest lifespan mice ever engineered by humans. They are dwarf and obese and the obesity tends to be central. They have exquisitely low blood insulin levels and it is thought that the reduced signalling through the GH/IGF-1/insulin system is responsible for their longevity. Adding GHrKO adipocytes to the abdomen of normal mice improves their glucose tolerance significantly.

The role of transplanted visceral fat from the long-lived growth hormone receptor knockout mice on insulin signaling

N-S mice are normal mice with a sham implantation which adds no extra adipose tissue, N-N are normal mice receiving extra intra-abdominal adipose tissue from normal mice (these should really have had some enhanced glucose tolerance but all of these transplant models differ slightly in technique) and in this case the GTT was done at about eight days post op, ie there may well have been a lot of healing derived IL-6 visiting the liver. The N-GHrKO mice are Bl/6 mice which have received adiopcytes from GHrKO dwarves, shown as black squares:


The GHrKO adipocytes are clearly a bit more effective than the normal eWAT adipocytes from the last post. Personally, I was surprised at how relatively small the enhancement of the glucose tolerance was, but then there is always that IL-6 to overcome, so perhaps they really are Super Adipocytes.

GHrKO mice develop extremely elevated GH levels, probably through a total lack of IGF-1 negative feedback, but this GH does nothing. Without a receptor the GH, functionally, isn't there. The lack of GH induced lipolysis pushes the balance of adipocyte size towards the obese phenotype. It seems to affect pretty well all adipose depots fairly equally. If we then go on to look at adipose specific FaGHrKO mice, these are obese too but lack any of the insulin sensitising effects of the whole body GHrKO mice:

The Role of GH in Adipose Tissue: Lessons from Adipose-Specific GH Receptor Gene-Disrupted Mice

"Surprisingly, FaGHRKOs shared only a few characteristics with global GHR−/− mice. Like the GHR−/− mice, FaGHRKO mice are obese with increased total body fat and increased adipocyte size. However, FaGHRKO mice have increases in all adipose depots with no improvements in measures of glucose homeostasis".

My assumption that lack it is the of growth hormone signalling in adipocytes which promotes obesity may not be the whole explanation. It is also true that these FaGHrKO adipocytes, which are possibly very insulin sensitive, are working in a mouse with normal insulin signalling outside of those KO adipocytes. This means that the mice will have normal levels of systemic insulin sensitivity/resistance. Putting calories anywhere other than their special adipocytes will have the potential to induce insulin resistance and any increase in insulin to deal with this will undoubtedly put more triglyceride in to the insulin hyper-sensitive FaGHrKO adipocytes.

So much for GH.

The second effect in whole body GHrKO mice is that there is essentially no IGF-1 produced either by the liver or as a local tissue hormone in response the "invisible" GH. This is not the case in FaGHrKO mice, their adipocytes may never see GH but they see plenty of IGF-1 which is coming from the perfectly normal GH sensitive liver of the recipient mouse. So is it a lack of IGF-1 signalling which underlies the insulin sensitising effect of GHrKO mice?

"Maybe" is the definitive answer and "probably" the more borderline answer... I guess "dunno" still has to rate pretty well too.

If you disrupt the IGF-1 receptor of cell lines in tissue culture post-developmentally (using siRNAs) or if you study genetically IGF-1 knockout foetal derived fibroblasts, they all show marked increases in insulin signalling, which is inducible by the siRNAs when these are used. I've stuck the studies down at the end of the post. Note that none of the studies used adipocytes, but the effect appears generic to pretty well all cell lines tested.

Now, this is either receptor suppression or a receptor absence being used to generate this effect in all of the studies I've found. It has nothing to do with IGF-1 signalling, ie it's not a metabolic effect, it mostly seems to be that IGF-1 receptors associate with insulin receptors and stop them working as well as they can do. So it doesn't appear a loss of ligand induced signalling effect (though obviously there is no signalling if there is no receptor), it's the physical lack of IGF-1 receptors which causes the effect. Clearly GHrKO mice do have IGF-1 receptors, they just never manufacture any IGF-1 to stimulate them. Do these unused receptors have the effect of suppressing long term insulin signalling? I suppose it is possible that permanent, lifelong, severe elimination of all IGF-1 exposure might actually down-regulate IGF-1 receptor gene expression, so allow insulin receptors to work more effectively. We'd need an IGF-1 receptor count to be done on some true GHrKO Laron mice to find out if this is the case. The study hasn't been done that I can find but, if IGF-1 receptor genes are mothballed in GHrKO mice, this would provide a complete explanation of the Laron insulin sensitivity effect and the rest of this post is irrelevant. Just in-case it's not so, here is the rest of the post. It is very, very speculative. And might be wrong:

There is just one paper which suggests that setting up a near-complete cessation of IGF-1 exposure, with normal IGF-1 receptor genes still present, at around 10 days of age (mice again) has a long term effect to enhance insulin receptor gene expression. To emphasise: these mice have the IGF-1 receptor gene (so they should be making IGF-1 receptors), just minimal IGF-1 exposure, rather like the Laron mice. Inducing this state very early in life appears to be key for sensitising to insulin signalling.

IGF-1 Regulates Vertebral Bone Aging Through Sex-Specific and Time-Dependent Mechanisms

"Within 3 months of a loss of IGF-1, there was a 2.2-fold increase in insulin receptor expression within the vertebral bones of our female mice, suggesting that local signaling may compensate for the loss of circulating IGF-1".

The ad hoc hypothesis in this last paper is that insulin signalling increases to meet metabolic needs, despite there still being IFG-1 receptors present to potentially interfere with insulin receptor function. This is the suggestion that makes me think that total loss of IGF-1 signalling, with genetically preserved IGF-1 receptor genes (but which no longer get expressed), might underlie the Laron GHrKO mouse insulin sensitivity effect. It's not just in adipose tissue, it's whole body. Everything becomes insulin sensitive and the level of insulin needed to maintain normoglycaemia plummets. Low insulin signalling = long life.

You then have to ask why this might happen if we are looking for a metabolic effect in excess of insulin receptor function modification.

IGF-1, in addition to it's anabolic role, also facilitates glucose ingress, much as insulin does. We know that this is the case from a number of studies including those involving humans with defective insulin receptors (Donohue Syndrome or Leprechaunism) or in severe lipodystrophy (such as Berardeinelli-Seip Syndrome) where IGF-1 facilitates glucose uptake clinically. This would allow tonic insulin-independent uptake of glucose to generate NADH for activation of the glycerophosphate shuttle (mtG3Pdh) and set bias for reducing the CoQ couple.

Overlaid above this we have genuine insulin signalling, used to facilitate closely controlled caloric ingress and glycolytic NADH generation for CoQ couple reduction. Only small amounts of insulin would be needed in excess of IGF-1 delivered glucose to allow enough extra ingress to instigate insulin signalling. Under caloric excess smaller than anticipated amounts of insulin would be need to induce insulin resistance promptly because there is the background IGF-1 facilitated glucose ingress.

Without the tonic IGF-1 facilitated glucose supply all glucose would have to come via insulin signalling. Insulin would find each cell calorically "emptier" of glucose than it would be had IGF-1 been signalling. With an enhanced extracellular to intracellular glucose gradient more glucose should enter the cell per GLUT4 translocated. In the post prandial state all glucose entry would be via insulin alone. There would be much less need to activate insulin-induced insulin resistance, or at least it would be significantly delayed, in the process of controlling caloric ingress. Much of the time insulin could be allowed to signal and that signalling would still merely supply cellular needs without needing to induce any insulin resistance for negative feedback.

You could describe the whole body lack of an IGF-1 background glucose supply as making all cells chronically "hungry", so improving both insulin signalling and glucose ingress per unit insulin signalling enacted.

This apparent  chronic hunger due to lack of IGF-1 signalling might be where the longevity effect come from and might be why genuine caloric restriction of GHrKO mice does not add to their already considerable lifespan.

That's how it looks to me.

I'd sort of hoped that would be it for this thread but certain adipocyte transplant studies keep niggling at the back of my mind. I'm trying to ignore them.

Peter


Here are those IGF-1 receptor disruption/deletion studies:

Down-regulation of Type I Insulin-like Growth Factor Receptor Increases Sensitivity of Breast Cancer Cells to Insulin

"We used small interfering RNA (siRNA) to specifically target down- regulation of IGF1R and found that IGF1R was efficiently suppressed without affecting IR expression. However, IGF1R down-regulation by siRNA sensitized cells to insulin. Our results suggest that specific targeting of IGF1R alone enhances insulin signaling, which may be an undesirable effect in breast cancer cells".

Disruption of the Insulin-like Growth Factor Type 1 Receptor in Osteoblasts Enhances Insulin Signaling and Action

"A striking observation from our studies was the increase in insulin responsivity in osteoblasts following deletion of the IGF-1R".

Insulin Receptor (IR) Pathway Hyperactivity in IGF-IR Null Cells and Suppression of Downstream Growth Signaling Using the Dual IGF-IR/IR Inhibitor, BMS-754807

"The insulin receptor (IR) pathway in IGF-IR null MEFs was hypersensitive to insulin ligand stimulation resulting in greater AKT phosphorylation than in wt or het MEFs stimulated with the same ligand".

Differential Roles of the Insulin and Insulin-like Growth Factor-I (IGF-I) Receptors in Response to Insulin and IGF-I

"In IGFRKO cells, insulin-induced phosphorylation of IRS-1 was enhanced, suggesting that IGFR may actually inhibit IR signaling to some extent".

Tuesday, October 23, 2007

Physiological insulin resistance

Back in mid summer 2007 there was this [unfixable link] thread on the Bernstein forum. Mark, posting as iwilsmar, asked about his gradual yet progressively rising fasting blood glucose (FBG) level over a 10 year period of paleolithic LC eating. Always eating less than 30g carbohydrate per day. Initially on LC his blood glucose was 83mg/dl but it has crept up, year by year, until now his FBG is up to 115mg/dl. Post prandial values are normal.

He wanted to know if he was developing diabetes.

I've been thinking about this for some time as my own FBG is usually five point something mmol/l whole blood. Converting my whole blood values to Mark's USA plasma values, this works out at about 100-120mg/dl. Normal to prediabetic in modern parlance. However my HbA1c is only 4.4%, well toward the lower end of normality and healthy. That's always assuming that I don't have some horrible problem resulting in very rapid red blood cell turnover. I don't think so...

I spend rather a lot of my life in mild ketosis, despite the 50g of carbs I eat per day. So I can run a moderate ketonuric urine sample with a random post-chocolate blood glucose value of 6.5mmol/l. What is happening?

Well, the first thing is that LC eating rapidly induces insulin resistance.

This is a completely and utterly normal physiological response to carbohydrate restriction. Carbohydrate restriction drops insulin levels. Low insulin levels activate hormone sensitive lipase. Fatty tissue breaks down and releases non esterified fatty acids. These are mostly taken up by muscle cells as fuel and automatically induce insulin resistance in those muscles. There are a couple of nice summaries by Brand Miller (from back in the days when she used her brain for thinking) here and here and Wolever has some grasp of the problem too.

This is patently logical as muscle runs well on lipids and so glucose can be left for tissues such as brain, which really need it. Neuronal tissue varies in its use of insulin to uptake glucose but doesn't accumulate lipid in the way muscle does, so physiological insulin resistance is not an issue for brain cells. However, while muscles are in "refusal mode" for glucose the least input, from food or gluconeogenesis, will rapidly spike blood glucose out of all proportion.

This is fine if you stick to LC in your eating. It also means that if you take an oral glucose tolerance test you will fail and be labelled diabetic.

In fact, even a single high fat meal can do this, extending insulin resistance in to the next day.

Here's a reference for this.

The general opinion in LC circles is that you need 150g of carbohydrate per day for three days before an oral glucose tolerance test. I did this carb loading thing, then performed my own OGTT. It came out very normal except for mild reactive hypoglycaemia.

So, I often walk around with a fasting blood glucose of 5.9mmol/l and in mild ketosis, yet have normal pancreatic and muscle function, provided I carb load before the test. 

BTW my FBG dropped to 4.3mmol/l after three days of carb loading. That then raises the question as to whether Mark "iwilsmar" and myself are typical of LC eating people, or an oddity or two.

This brought to mind the self selected macronutrient study performed on mice by Ortman, Prinzler and Klause. They allowed mice to select their own diet and, lo and behold, the mice chose (by calories, not weight!) 82% fat and 5.6% carbohydrate. Sensible mice. NB These German mice should each be given Professorships of Nutrition at medical schools in the most obese nations of the world. Quite what we should do with the current professors I'm not sure, but I bet the mice could think of something.

Anyway, these mice are cool. The only thing that bugged me when I first read the paper was that they had a higher fasting blood glucose than those poor mice fed the normal junk which passes for laboratory mouse "chow". This now fits in to an overall pattern. Elevated non esterified fatty acids induce physiological insulin resistance and a higher than expected FBG level.

A simple switch to higher carbohydrate eating (in myself) allows the normal underlying pancreatic and muscle function to show. It also fits in with the FBG of 3.5mmol/l found in the carbohydrate fuelled natives in the Kitava studies. So do I worry about a FBG of over 5.5mmol/l? Not while my HbA1c is 4.4%.

Peter

Saturday, July 05, 2025

Protons (79) Define insulin resistance

It occurred to me while finishing the Carpentier post that it is a beautiful model of metabolic syndrome.

My definition of insulin resistance is an adaptive response to limit insulin-facilitated metabolic substrate ingress in to a cell when an alternative metabolic substrate is being utilised concurrently. With a few caveats.


This is exactly what Carpentier generated when he infused Intralipid/heparin to supply FFAs continuously during an hyperglycaemic clamp test. Look at the control group (open circles):


With glucose clamped at 20mmol/l from 120min onward insulin eventually rises to ~700pmol/l which suppresses FFA availability toward the end of the clamp to around 0.050mmol/l or lower. At this point the subjects are running their metabolism almost completely on the glucose supplied by the infusion and FFAs are, appropriately, sequestered in to adipocytes.

The filled circles are the same people but this time, still with glucose clamped at 20mmol/l, they cannot suppress FFAs using insulin because the FFAs are being supplied exogenously using Intralipid. Free fatty acid release from adipocytes will still drop to near zero, as in the control situation, but plasma FFAs are artificially maintained exactly at fasting levels by the infusion.

The insulin resistance of fasting is real. This essential insulin resistance is not some "problem" to be "cured". It is the suppression of glucose uptake when fatty acid generated ROS are signalling that glucose is not needed, so insulin mediated glucose uptake is also not currently needed. Conveniently, this leaves glucose free for use by the brain.

Intralipid here supplies almost exactly the FFAs needed to imitate fasting (~0.70mmol/l) at a time when blood glucose is clamped at 20mmol/l and insulin is high. Resisting insulin under these circumstances is NOT pathology. It is purely adaptive. Fatty acids at 0.70mmol/l supply almost all of a subject's metabolic needs outside of the brain. Subjects do not need the glucose uptake which insulin and hyperglycaemia are trying to force on them. So they resist it. I would do the same.

You can "cure" this insulin "resistance" by turning off the lipid infusion. Probably in less than half an hour, extrapolating from Shulman's work.

So what goes wrong in metabolic syndrome?

The issue in metabolic syndrome is that you cannot turn off the supply of free fatty acids by pressing the stop button on an infusion pump full of Intralipid.

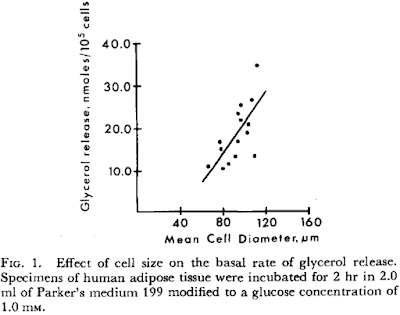
In metabolic syndrome the fatty acids are coming from adipocytes which are larger than they should be and as such have elevated basal lipolysis. We've all read this:

Effect of cell size on lipolysis and antilipolytic action of insulin in human fat cells

showing the effect of cell size on basal lipolysis:


and the inability of insulin, even at preposterous dose rates, to suppress this lipolysis:


So the (inappropriate) fatty acid supply to insulin sensitive cells in obesity *requires* insulin resistance. It is derived from large adipocytes, not small adipocytes (which have low rates of basal lipolysis), ie adipose hypertrophy necessitates insulin resistance while adipose hyperplasia does not. At the same fat mass.

Of course it is possible to stop free fatty acid release mediated through basal lipolysis using acipimox. Again, we've all read this one:

Overnight Lowering of Free Fatty Acids With Acipimox Improves Insulin Resistance and Glucose Tolerance in Obese Diabetic and Nondiabetic Subjects

and struggled to make out the numbers from its spectacularly low quality pdf file illustrations. I think I have the scales correct here:


The insulin tolerance is markedly improved, clearly, but is it not normal. Also, if you work through the rest of the paper, the mitochondria are still far from normal and I have absolutely no problem with adducts of 4-HNE and its relatives causing problems in their own right within the electron transport chain. They are, after all, an intrinsic part of both insulin's activation and deactivation pathways. I wouldn't ignore them. It's a whole series of potential posts about how and why they might be formed. Or not.

But to get back to metabolic syndrome. The obvious question is "Why are adipocytes so big as to be spilling FFAs through size-related elevated basal lipolysis in the first place?".

Insulin. Insulin makes small fat cells in to large fat cells. Stearate is the most effective fatty acid at generating the ROS signal which limits this, with palmitate a close second. Failure to limit insulin signalling, as neatly demonstrated by safflower oil in the Cocoa study, is what makes an adipocyte excessively insulin sensitive and subsequently engorged. With insulin resistance following on as a secondary change derived from the size of adipocytes.

Linoleic acid is a dud for limiting insulin signalling. It's the pathology.

Peter

Friday, January 19, 2018

Metformin (06) Insulin-induced insulin resistance is real

When I started reading about insulin-induced insulin resistance I began with this paper:

Insulin Is a Stronger Inducer of Insulin Resistance than Hyperglycemia in Mice with Type 1 Diabetes Mellitus (T1DM)

It's a nice paper. They took NOD mice which had developed their NOD mouse version of T1DM and either treated them with insulin detemir, or didn't. They had a third group which never developed T1DM so were never treated and these served as a control group.

The treated diabetic NOD mice were gradually stabilised over a two week period then kept normoglycaemic for a further two days. They were assessed for insulin sensitivity using an insulin tolerance test, where a dose of neutral insulin is injected then you track what happens to the blood glucose concentration. The more insulin sensitive the animal, the more the glucose level drops:


It's pretty obvious that the detemir treated mice (top line) have absolutely no response to neutral insulin and that both non-treated diabetic mice and never-diabetic mice drop their blood glucose levels by about 50% on this particular dose of neutral insulin.

I could stop this post here. Exogenous insulin induces insulin resistance in T1DM mice, as it does in people. This is fact.

But of course you should not just accept this. The question is: Why?

Why does "enough" insulin as secreted by the pancreas to produce normoglycaemia (in the never-diabetic control group of mice) cause no insulin resistance whereas insulin detemir given to produce the same level of normoglycaemia induces striking insulin resistance in those treated NOD mice?

Recall that the hyperglycaemia in T1DM has little to do with the lack of insulin per se. The hyperglycaemia is caused by an excess of glucagon from the alpha cells of the pancreas. Insulin starts its control of hyperglycaemia by the suppression of pancreatic glucagon secretion, it's a local action within the islets. How high this concentration of insulin is under normal physiological conditions is quite hard to determine but it is likely to be a lot higher than the diluted insulin concentration in the portal vein, heading towards the liver.

The diluted insulin within the portal vein arrives at the liver where its next job is to suppress hepatic glucose output, again in antagonism to glucagon.

Finally, if glucose from the liver continues to enter the systemic circulation, the function of insulin here is to push that glucose in to any cells that will take it. Muscle and adipose tissue being two major targets.

So under normal physiology there is a gradient of insulin concentrations from very high within the Islets of Langerhans, to significantly lower at the hepatocytes, down to much lower in the systemic circulation.

Exogenous insulin produces no such gradient. It drains from its injection site into the systemic veins and is then redistributed, at a single concentration, throughout the body.

This will never effectively suppress alpha cell glucagon secretion and will only do a modestly effective job of suppressing hepatic glucose output. So glucose will be continuously secreted in to the systemic circulation. The dose of detemir used has to be enough to mop up this excess glucose supply, and it can only put it in to cells sensitive to insulin throughout the body. Muscle cells. Adipocytes.

Now look at it from recipient cell's point of view. Glucagon is high, hepatic glucose output is high and this continuous supply of glucose is being allowed in to systemic cells by the exogenous insulin. To these cells the glucose supply looks like a meal being digested (high glucose, high insulin). The cells rapidly realise that they have enough calories (High NADH levels, high mitochondrial delta psi, reduced electron transport chain). They don't want any more. Their solution: insulin-induced insulin resistance (ie reverse electron transport to generate H2O2 at complex I and so inactivate insulin signalling).

That's what happens.

So the very effective control of blood glucose in these NOD mice is at the cost of continuous exposure to supraphysiological insulin levels coupled with a supraphysiological glucose supply, because the systemic cells are "covering for" the failure to replicate the normal gradient from islet to liver to systemic circulation.

Exogenous insulin can never be physiological.

Aside: Except, of course, under deeply ketogenic eating where only minimal insulin is ever secreted, very little is metabolised, the gradients between alpha cells, hepatocytes and adipocytes flattens out and the correct physiology is for glucagon to be elevated with minimal insulin. I've posted this before. T1DM patients have no choice, ketosis is the only physiological state which can be fairly well mimicked using very low doses of exogenous insulin. End aside.

I would never suggest that exogenous insulin has no effect on pancreatic glucagon secretion or elicits no suppression of hepatic glucose output. It will always have some effect, but there will always be an abnormal emphasis of its effect on systemic tissues.

This is the situation in NOD mice and T1DM people. They become insulin resistant by simply using exogenous insulin to ensure normoglycaemia.

I guess the next question, which was asked by the same group whose paper we've just been looking at, is whether simply injecting exogenous insulin in to normal mice induces insulin resistance. That's the next paper, in the next post.

Spoiler: Of course it does.

Peter

Sunday, July 04, 2021

Obesity and diabetes (3) Acipimox

I first went looking for papers on Acipimox in 2014. I had read that it was an inhibitor of lipolysis and I was interested in how much weight gain it caused. Back in those days I was still fairly attached to the most basic of carbohydrate-insulin-models of obesity. If you consider that insulin causes weight gain by the inhibition of lipolysis, giving a non-insulin inhibitor of lipolysis should do the same... Shouldn't it?

Well, no, it doesn't. Acipimox produces a profound fall in free fatty acids and a marked improvement in glucose tolerance. Very, very occasionally I found snippets in discussion fora that it could increase hunger but this was not by any means routine. These give the flavour:

Effect of the Antilipolytic Nicotinic Acid Analogue Acipimox on Whole-Body and Skeletal Muscle Glucose Metabolism in Patients with Non-insulin-dependent Diabetes Mellitus

Effect of a Sustained Reduction in Plasma Free Fatty Acid Concentration on Intramuscular Long-Chain Fatty Acyl-CoAs and Insulin Action in Type 2 Diabetic Patients


All of which sounds very good (unless you are into the CIM of obesity!) and you have to wonder quite why Acipimox has not become standard of care and have largely reversed the current global diabetes pandemic. In fact, a recent 2020 meta-analysis of niacin (the parent compound from which Acipimox is derived) trials suggests we might be remiss in failing to do so:


But then you could go on to ask why giving niacin itself  might actually make people with impaired glucose tolerance flip in to frank type two diabetes (amongst other medical catastrophes) with worrying regularity

Effects of extended-release niacin with laropiprant in high-risk patients

Of course you could blame the laropiprant, given to suppress the niacin flushing. Or you could more usefully think about the metabolic consequences of dropping plasma FFAs by using a potent inhibitor of lipolysis.

If we work on the basis that DMT2 is essentially the down stream consequence of the inability of distended adipocytes to limit basal lipolysis, it comes as no surprise that artificially shutting down release of FFAs might improve markers of metabolic health.

The cost would be larger adipocytes.

But this doesn't happen, at least not much. The explanation is contained in this paper from 1992, largely looking at the reasons for the long term failure of Acipimox to control FFA levels:


It's simple. Making adipocytes retain their lipids increases their size. There is no suggestion that tolerance develops to this. All that happens is that there is a rebound increase in basal lipolysis as the Acipimox wears off. The drug-induced transient fall in FFAs produces a transient decrease in the oversupply of calories from FFAs, so cells should and must adapt to by reducing insulin resistance. Numbers improve at the cost of bigger adipocytes. As soon as the drug wears off the adipocytes, now bigger, reinstate basal lipolysis at their previous high rate plus some extra due to the extra distending effect of Acipimox. As they off-load their extra size by releasing FFAs, the physiological need of other cells in the body to resist insulin is both restored and augmented.

There is no net benefit and all the drug might do, if it does produce any increase in adipocyte size, is to convert IGT people, with some reserve function remaining in their adipocytes, in to very sightly heavier diabetics who have less ability to suppress adipocyte size-induced increased basal lipolysis.

If you are pre diabetic but not glycosuric and you become glycosuric in the periods between Acipimox/niacin doses you will convert from pre-diabetic to diabetic, assuming you use glycosuria as your marker for diabetes.

Peter

Wednesday, September 01, 2010

Axen and Axen (2)

OK, the biggest mistakes in A&A's 2006 paper was, in my book, Atkins bashing. There, I am biased. Citing the Atkins Diet specifically and using this citation as the basis for their study design is problematic. I don't know if A&A ever read ref 1 as cited but, believe me, these rats were not on the Atkins Induction or the subsequent Ongoing Weight Loss phases. Generally the Atkins diet involves Food plus artificial sweeteners and some easily avoidable non-foods such as soy flour. And vegetables.

So what did they do? They took a group of lab rats and made them obese with trans fatty acid enriched Crisco as 60% of their calories. They then split the rats in to two groups, one was given 60% of calories as carbohydrate through out. The other group was given 5% carbohydrate for 2 weeks then 15% carbohydrate for a month, à la Atkins. Both groups were moderately energy restricted, dictated by a somewhat random decision protocol.

There was a parallel group eating crapinabag (CIAB) throughout (no Crisco). Glucose tolerance tests, with insulin measured at 20 minutes, were performed at various time points.

What went wrong in 2006?

Things started well with the Crisco rats having higher blood glucose at 10 minutes in to the GTT than the CIAB rats. Insulin levels were a lot higher in the Criso rats 20 minutes in to the test by which time glucose was identical between Crisco and CIAB groups. That's Graph A. Crisco causes insulin resistance.


Things were going reasonably well for Atkins bashing at the end of the two week "Atkins Induction" phase. During GTT the 60% carb group were slightly lower in glucose and this made p<0.05 at 10 minutes. However the cracks are beginning to show. The "Atkins Induction" group had an insulin at 20 minutes in to GTT of 600pM, the 60% carb group needed an insulin of over 900pM to achieve the marginally lower glucose level at this point. The insulin values were, luckily for A&A, not significantly different. Fasting insulin at this point was also lower in the "Atkins Induction" group. A&A were lucky on the p values here too. Here's graph B with that spiked glucose at 10 minutes:


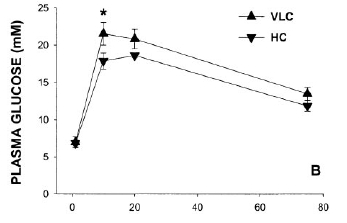
By the end of the experiment at 14 weeks the Atkins Group had been given more (15% of calories) carbohydrate. The GTT at this time point is shown here:


Now you need to get your glasses on for this one. Can you see any difference between the "Atkins Ongoing Weight Loss" (VLC) group and the 60% carbohydrate (HC) weight loss groups? No? Me neither.

Insulin values were slightly better in the 60% carb group but again nothing significant. Both weight loss groups had lower insulin values than the CIAB group! All NS again.

So there we have it: Atkins Ongoing Weight Loss, as interpreted by A&A, gives a GTT curve which is superimposed on the 60% carbohydrate weight loss group. ATKINS is GOOD!

There is a load of bollocks in the discussion about the impaired insulin response in the Atkins group in graph B. To me shifting glucose with a lower insulin level is good, not bad. The spike at 10 minutes is the only saving grace to the funding generating ability of this study.

But graph C is just hysterical.

Okay, A&A are not stupid. They worked out exactly what went wrong in graph C and what was going well in graph B.

So they went out and got more funding to demonstrate CONCLUSIVELY that the Atkins Diet makes you diabetic. They got that funding. These people are good, make no mistake. They got the desired result second time round. How many people get a second chance like this? They published in 2010.

Here is graph a from 2010, directly comparable to graph A from 2006.


Very similar but tidied up in 4 years of refining the model. Or maybe the CIAB has been improved. Anyhoo, same result. Crisco does nasty things to GTT curves.

Next is graph b, which is like graph B above but is after a month rather than 2 weeks and has the on going Crisco group included. The very low carbohydrate group is looking a lot like the Crisco group by now...


But here is the Money Shot in graph c from 2010. Just look at the Crisco curve (HF) and the 5% carbohydrate (VLC) curve. Just look at that fit!


I told you these people were good!

But also go back and look at the blooper graph C from 2006.

So what is going on?

There is a nice pointer in line seven of Table 2, "Soleus TAG". This is the amount of intra myocyte lipid in a typical muscle. It is a marker of how reluctant that muscle is going to be to accept glucose. Two groups have high soleus TAG. The Crisco poisoned (HF) group throughout and the VLC group at 16 weeks.


The explanations for why these two groups have high soleus TAG is likely to be different. Both will, in all certainty, reflect elevated FFAs in the plasma. But the Crisco poisoned group will have elevated FFAs, 24/7, despite 15% of calories as starch. We know from the 2006 blooper that 15% of calories as starch will give a GTT curve in VLC rats which matches the 60% carb group EXACTLY. Not so if you are Crisco poisoned.

The VLC rats on 5% of carbs will have elevated FFAs 24/7 because they would be dead without them. They are on a starvation diet of which only 5% is carbs. Without FFAs they would run their muscles on glucose. They don't get enough glucose per day to do this and still keep their brain alive. Death is not an option.

So the Crisco group has elevated TAG in soleus muscle in the presence of carbohydrate in the diet. It's pathological. The VLC group has elevated TAG in their soleus muscle because they had minimal free glucose available, which is physiological.

BTW either fasting or a brief period without carbohydrate will promptly elevate muscle TAG in humans. It is an utterly normal response to a reduced supply of glucose. The actual signal for muscle insulin resistance is not likley to be the tri acyl glycerol molecules themselves because athletes have bucket loads of this without insulin resistance. More likely is a more ephermeral moiety such as Acyl-CoA molecules or diglycerides which more closely reflect FFA supply. In a GTT the glucose supply is massively supraphysiological. For insulin sensitivity to return to LC muscles it takes time for insulin to spike, insulin to get to adipocytes, adipocytes to respond to insulin, FFA level in blood to drop and FFA derivative level in muscle to drop. It's hardly surprising that the 10 minute glucose peak was higher in the VLC rats during GTT. However, as soon as the muscles clear FFA derivatives they are still geared up to go with glucose, nae problem, nae bother. I'll come on to issues with insulin later. Obviously the Crisco poisoned rats are obese and their adipocytes will have an inability to suppress FFA release in response to insulin. That's how it is if you eat Crisco.

Let's look at the insulin responses. All of the fasting insulin levels were about the same. Obviously the VLC had the lowest insulin and almost certainly the lowest HOMA score although p might still have been > 0.05. By week 16 the insulin response to GTT was interesting.

The VLC rats mimicked the Crisco (HF) group's glucose curve. But they did it with just 1.79ng/ml of insulin. The Crisco rats needed 2.93ng/ml of insulin (p<0.05). The lower curve with open diamonds is the 60% carb group. The curve looks good until you realise that these rats needed as much insulin as the Crisco rats to achieve this beautiful curve, nearly twice that in the VLC group (2.95ng/ml vs 1.79ng/ml, p<0.05).

So which rats are the most insulin sensitive? Not the Crisco rats. I'll accept that. Just say no to Crisco... It is completely arguable between the VCL and 60% carb group.

BUT. What would have happened if the VLC group had produced the same insulin response as the 60% carb group? Impossible, scream Axen and Axen. The VCL group have a blunted insulin response. It makes them well on the road to diabetes, metabolic syndrome, blindness, dialysis, we need the funding...

Calm down Peter, bit OTT there!

Except metabolic syndrome is characterised by elevated insulin, not depressed insulin. Duh.

I have to thank Helen who placed a comment on another post. She pointed out that glucokinase in the pancreas, the enzyme which the pancreas uses to sense glucose in the portal blood, is down regulated in response to carbohydrate restriction. Oh.

It is, err, up regulated in carbohydrate surplus.

This is what "bit" Axen and Axen in 2006. It looks like 15% of calories as carbohydrate in a VLC non-Crisco situation is adequate (on a high protein background) to allow pancreatic insulin secretion in response to glucose to become identical to that produced by rats on a 60% carbohydrate diet. Muscle TAG and associated molecules will drop too. Hence the overlay of the GTT curves in 2006.

Let us assume, very reasonably, that the VLC rats in 2010, on a 5% carb, energy restricted diet, are not expecting to deal with hyperglycaemia any time soon. They down regulate glucokinase production. Then some joker injects 1g/kg of glucose in to their peritoneal cavity. No one up regulates their glucokinase in 10 minutes, not even Super Rat*. Insulin response is blunted. Hyperglycaemia results.

*Actually Super Rat could do this but she is always busy saving the planet (again) and doesn't have time to help out here.

What would have happened with a few days carb loading in the VLC group before the GTT? Well, we (that "we" includes A&A) know the answer to this from 2006. Did you really think A&A are stupid? How many times do I have to point out that these people are good. Very, very good. They know that to get a "bad" result for VLC you must NOT increase carbs pre glucose load in a GTT.

Does anyone think that neither Axen nor Axen has heard of glucokinase? That would mean they're stupid. They're not, they know that if they allowed 15% carbs for a few days the VLC group would overlay the curve of the 60% carb group. For crying out loud, they published the damned curves themselves!

No. The effect of increased carbs on a VLC is not "unclear" (their word). It adjusts pancreatic insulin secretion to deal with carbs when carbs form a significant part of the diet. That's called physiology!

In summary:

Do A&A have a paradigm to support, a mortgage or two to pay, a living to make, careers to develop?

A few fatties getting injured is of no concern, provided the models can be adjusted to keep the funding coming through.

Will people edging towards type 2 diabetes get injured by a very low carbohydrate diet or will they be injured by A&A's funding success? What if they eat low fat high carbohydrate in the real world? What is hunger?

You decide. Then go eat some fat.

Peter

But not Crisco. Just say no....