The group which demonstrated that exogenous insulin induces insulin resistance in T1DM NOD mice went on to demonstrate that exogenous insulin induces T2DM in normal* mice on a normal chow diet.
*If you can describe Bl/6 mice as normal, with their failure to assemble mitochondrial super complexes and all of the potential implications that has on all sorts of metabolic effects. But I digress, as always.
Exposure to excess insulin (glargine) induces type 2 diabetes mellitus in mice fed on a chow diet
So you can imagine that I quite like this group. But they are naughty and the naughtiness is very annoying.
If you read about insulin administration in the current paper you will be presented with this bollocks:
"The dose of glargine was determined according to our previous experiments (Liu et al. 2009a )..."
What they did in Liu et al 2009a was to titrate the dose of insulin determir upwards to just achieve normoglycaemia. Different doses were needed in individual mice because that's what diabetes is like in NOD mice. That is NOT what they did in this current paper to the Bl/6 mice. Here they used glargine and they went straight in at a massive supraphysiological dose:
"C57BL/6 (B6) mice (male, 6–9-week old) from Charles River were treated with either saline or a long- and slow-acting insulin reagent, glargine (50 Unit/kg body weight, s.c. injection, once a day), for 8 weeks".
Even allowing for metabolic scaling from humans down to mice this is a massive dose of glargine. It's not remotely what they did with the NOD mice.
EDIT: Going back through the first paper the NOD T1 mice did actually end up with the average group dose of detemir being 25iu/kg twice daily. The difference in protocol is that the group is assuming that glargine 50iu/kg once daily is equivalent to detemir 25iu/kg twice daily. A big assumption. And that this would be fine for all mice. And that going in at the full dose rate on day one rather than titrating up over two weeks would also be equivalent. But the dose rate is more reasonable than I expected. END EDIT.
So there are fibs in the methods. Can you really trust these folks? Not much choice really...
None of the mice died on the glargine 50iu/kg dose, so I think we can assume that they developed a marked and rapid onset insulin-induced insulin resistance.
When you wade through the IRS1 serine phosphorylation, IRS1 tyrosine phosphorylation, Akt phosphorylation, total Akt etc etc etc in the results section the end conclusion is that the liver became insulin resistant but the gastrocnemius muscle (representing what I called "systemic" tissues) did not. Bummer for my nice, plausible and apparently incorrect ideas.
So to ease my cognitative dissonance I went back to our initial paper and waded through the IRS1 serine phosphorylation, IRS1 tyrosine phosphorylation, Akt phosphorylation, total Akt etc etc etc and discoved that, lo and behold, that under a clinical protocol the gastrocnemius did become insulin resistant. So did the liver but I can live with that, after all the liver does have a (bloody enormous) arterial blood supply in addition to receiving flow from the portal vein.
Phew, biases in-tact.
It's interesting to see in the paper that exogenous glargine actually destroys the pancreas. Beta cell mass falls, their mitochondria undergo marked oxidative stress and this allows the failure to deal with the hepatic insulin resistance induced by glargine 50iu/kg, hence the induction of diabetes.
I think the take home message is that taking glargine 50iu/kg won't help your own clinical diabetes, should you be so affected. It's also too high a dose if you are attempting to do harm!
Anyhow. Growth hormone and insulin resistance next, probably.
Peter
Saturday, January 20, 2018


Friday, January 19, 2018
Metformin (06) Insulin-induced insulin resistance is real
When I started reading about insulin-induced insulin resistance I began with this paper:
Insulin Is a Stronger Inducer of Insulin Resistance than Hyperglycemia in Mice with Type 1 Diabetes Mellitus (T1DM)
It's a nice paper. They took NOD mice which had developed their NOD mouse version of T1DM and either treated them with insulin detemir, or didn't. They had a third group which never developed T1DM so were never treated and these served as a control group.
The treated diabetic NOD mice were gradually stabilised over a two week period then kept normoglycaemic for a further two days. They were assessed for insulin sensitivity using an insulin tolerance test, where a dose of neutral insulin is injected then you track what happens to the blood glucose concentration. The more insulin sensitive the animal, the more the glucose level drops:

It's pretty obvious that the detemir treated mice (top line) have absolutely no response to neutral insulin and that both non-treated diabetic mice and never-diabetic mice drop their blood glucose levels by about 50% on this particular dose of neutral insulin.
I could stop this post here. Exogenous insulin induces insulin resistance in T1DM mice, as it does in people. This is fact.
But of course you should not just accept this. The question is: Why?
Why does "enough" insulin as secreted by the pancreas to produce normoglycaemia (in the never-diabetic control group of mice) cause no insulin resistance whereas insulin detemir given to produce the same level of normoglycaemia induces striking insulin resistance in those treated NOD mice?
Recall that the hyperglycaemia in T1DM has little to do with the lack of insulin per se. The hyperglycaemia is caused by an excess of glucagon from the alpha cells of the pancreas. Insulin starts its control of hyperglycaemia by the suppression of pancreatic glucagon secretion, it's a local action within the islets. How high this concentration of insulin is under normal physiological conditions is quite hard to determine but it is likely to be a lot higher than the diluted insulin concentration in the portal vein, heading towards the liver.
The diluted insulin within the portal vein arrives at the liver where its next job is to suppress hepatic glucose output, again in antagonism to glucagon.
Finally, if glucose from the liver continues to enter the systemic circulation, the function of insulin here is to push that glucose in to any cells that will take it. Muscle and adipose tissue being two major targets.
So under normal physiology there is a gradient of insulin concentrations from very high within the Islets of Langerhans, to significantly lower at the hepatocytes, down to much lower in the systemic circulation.
Exogenous insulin produces no such gradient. It drains from its injection site into the systemic veins and is then redistributed, at a single concentration, throughout the body.
This will never effectively suppress alpha cell glucagon secretion and will only do a modestly effective job of suppressing hepatic glucose output. So glucose will be continuously secreted in to the systemic circulation. The dose of detemir used has to be enough to mop up this excess glucose supply, and it can only put it in to cells sensitive to insulin throughout the body. Muscle cells. Adipocytes.
Now look at it from recipient cell's point of view. Glucagon is high, hepatic glucose output is high and this continuous supply of glucose is being allowed in to systemic cells by the exogenous insulin. To these cells the glucose supply looks like a meal being digested (high glucose, high insulin). The cells rapidly realise that they have enough calories (High NADH levels, high mitochondrial delta psi, reduced electron transport chain). They don't want any more. Their solution: insulin-induced insulin resistance (ie reverse electron transport to generate H2O2 at complex I and so inactivate insulin signalling).
That's what happens.
So the very effective control of blood glucose in these NOD mice is at the cost of continuous exposure to supraphysiological insulin levels coupled with a supraphysiological glucose supply, because the systemic cells are "covering for" the failure to replicate the normal gradient from islet to liver to systemic circulation.
Exogenous insulin can never be physiological.
Aside: Except, of course, under deeply ketogenic eating where only minimal insulin is ever secreted, very little is metabolised, the gradients between alpha cells, hepatocytes and adipocytes flattens out and the correct physiology is for glucagon to be elevated with minimal insulin. I've posted this before. T1DM patients have no choice, ketosis is the only physiological state which can be fairly well mimicked using very low doses of exogenous insulin. End aside.
I would never suggest that exogenous insulin has no effect on pancreatic glucagon secretion or elicits no suppression of hepatic glucose output. It will always have some effect, but there will always be an abnormal emphasis of its effect on systemic tissues.
This is the situation in NOD mice and T1DM people. They become insulin resistant by simply using exogenous insulin to ensure normoglycaemia.
I guess the next question, which was asked by the same group whose paper we've just been looking at, is whether simply injecting exogenous insulin in to normal mice induces insulin resistance. That's the next paper, in the next post.
Spoiler: Of course it does.
Peter
Insulin Is a Stronger Inducer of Insulin Resistance than Hyperglycemia in Mice with Type 1 Diabetes Mellitus (T1DM)
It's a nice paper. They took NOD mice which had developed their NOD mouse version of T1DM and either treated them with insulin detemir, or didn't. They had a third group which never developed T1DM so were never treated and these served as a control group.
The treated diabetic NOD mice were gradually stabilised over a two week period then kept normoglycaemic for a further two days. They were assessed for insulin sensitivity using an insulin tolerance test, where a dose of neutral insulin is injected then you track what happens to the blood glucose concentration. The more insulin sensitive the animal, the more the glucose level drops:

It's pretty obvious that the detemir treated mice (top line) have absolutely no response to neutral insulin and that both non-treated diabetic mice and never-diabetic mice drop their blood glucose levels by about 50% on this particular dose of neutral insulin.
I could stop this post here. Exogenous insulin induces insulin resistance in T1DM mice, as it does in people. This is fact.
But of course you should not just accept this. The question is: Why?
Why does "enough" insulin as secreted by the pancreas to produce normoglycaemia (in the never-diabetic control group of mice) cause no insulin resistance whereas insulin detemir given to produce the same level of normoglycaemia induces striking insulin resistance in those treated NOD mice?
Recall that the hyperglycaemia in T1DM has little to do with the lack of insulin per se. The hyperglycaemia is caused by an excess of glucagon from the alpha cells of the pancreas. Insulin starts its control of hyperglycaemia by the suppression of pancreatic glucagon secretion, it's a local action within the islets. How high this concentration of insulin is under normal physiological conditions is quite hard to determine but it is likely to be a lot higher than the diluted insulin concentration in the portal vein, heading towards the liver.
The diluted insulin within the portal vein arrives at the liver where its next job is to suppress hepatic glucose output, again in antagonism to glucagon.
Finally, if glucose from the liver continues to enter the systemic circulation, the function of insulin here is to push that glucose in to any cells that will take it. Muscle and adipose tissue being two major targets.
So under normal physiology there is a gradient of insulin concentrations from very high within the Islets of Langerhans, to significantly lower at the hepatocytes, down to much lower in the systemic circulation.
Exogenous insulin produces no such gradient. It drains from its injection site into the systemic veins and is then redistributed, at a single concentration, throughout the body.
This will never effectively suppress alpha cell glucagon secretion and will only do a modestly effective job of suppressing hepatic glucose output. So glucose will be continuously secreted in to the systemic circulation. The dose of detemir used has to be enough to mop up this excess glucose supply, and it can only put it in to cells sensitive to insulin throughout the body. Muscle cells. Adipocytes.
Now look at it from recipient cell's point of view. Glucagon is high, hepatic glucose output is high and this continuous supply of glucose is being allowed in to systemic cells by the exogenous insulin. To these cells the glucose supply looks like a meal being digested (high glucose, high insulin). The cells rapidly realise that they have enough calories (High NADH levels, high mitochondrial delta psi, reduced electron transport chain). They don't want any more. Their solution: insulin-induced insulin resistance (ie reverse electron transport to generate H2O2 at complex I and so inactivate insulin signalling).
That's what happens.
So the very effective control of blood glucose in these NOD mice is at the cost of continuous exposure to supraphysiological insulin levels coupled with a supraphysiological glucose supply, because the systemic cells are "covering for" the failure to replicate the normal gradient from islet to liver to systemic circulation.
Exogenous insulin can never be physiological.
Aside: Except, of course, under deeply ketogenic eating where only minimal insulin is ever secreted, very little is metabolised, the gradients between alpha cells, hepatocytes and adipocytes flattens out and the correct physiology is for glucagon to be elevated with minimal insulin. I've posted this before. T1DM patients have no choice, ketosis is the only physiological state which can be fairly well mimicked using very low doses of exogenous insulin. End aside.
I would never suggest that exogenous insulin has no effect on pancreatic glucagon secretion or elicits no suppression of hepatic glucose output. It will always have some effect, but there will always be an abnormal emphasis of its effect on systemic tissues.
This is the situation in NOD mice and T1DM people. They become insulin resistant by simply using exogenous insulin to ensure normoglycaemia.
I guess the next question, which was asked by the same group whose paper we've just been looking at, is whether simply injecting exogenous insulin in to normal mice induces insulin resistance. That's the next paper, in the next post.
Spoiler: Of course it does.
Peter
Sunday, January 14, 2018
A wander off in to dietary protein calories
There is prize for developing the longest-lived mouse in the world. It was set up in 2003 and the first award went to Dr Bartke.
"On June 8th, 2003, the inaugural Methuselah Prize was awarded to Dr. Andrzej Bartke for the "Methuselah Mouse" that lived the equivalent of 180 human years".
You can read a bit more about growth hormone receptor knockout mice and other forms of dwarf mice in Dr Bartke's review, written soon after winning the prize:
Life extension in the dwarf mouse.
It's now 2018 and no one appears to have improved on the Laron mouse model which won that initial prize. Over the last 15 years there has been a lot of interesting research but no numerical progress. I think it is worth noting that Laron mice are not GH deficient, they have tons of the stuff. They simply do not have the receptor to do anything with it. Which, in particular, means they cannot generate IGF-1.
How do Laron humans fare? The best studied group live in Colombia. They're of very short stature. They have no recorded cases of diabetes and only one recorded cancer, which was non lethal*. Their every biochemical parameter is exemplary, especially insulin level and HOMA score. Do they all live to be centenarians? Apparently not. Being a dwarf in Columbia requires alcohol in large amounts to render life tolerable, plus accidental trauma is another huge problem. Quite what would happen if these people lived under similar conditions to the Laron mice in Dr Bartke's laboratory is a question which is unlikely ever to be answered! Longevity in the real world vs what works under ideal conditions...
*Dr Laron has reported two cases of Laron Syndrome people developing diabetes (and there are others), including the complications such as atherosclerosis, renal disease and diabetic retinopathy. This is an interesting observation and might be worth a post on its own some time.
There are tantalising suggestions from other GH modifying mutations in humans. One of the better studied of these is carried by the "Little people" of Krk in Croatia. More from Dr Laron:
Do deficiencies in growth hormone and insulin-like growth factor-1 (IGF-1) shorten or prolong longevity?
Longevity of the hypopituitary patients from the island Krk: a follow-up study
They have a mutation which causes multiple pituitary hormone deficits, ACTH secretion excepted. There are too few documented people with this genetic problem to say a great deal about longevity but ages of 68, 77, 83 and 91 years have been recorded in the four individuals to have died since detailed observations began. The equivalent syndrome in mice under lab conditions promotes longevity.
One of the nicer studies looking at human height (viewing this as a GH/IGF-1 signalling surrogate) and longevity is this one:
Shorter Men Live Longer: Association of Height with Longevity and FOXO3 Genotype in American Men of Japanese Ancestry
It found, as you might expect, an inverse relationship between height at enrolment and longevity. They also tied the relationship, observationally, to a down-regulating SNP of the FOXO3 gene, FOXO genes being major controllers of the insulin/IGF-1 signalling system.
Which genes you have is not under your control. What you do with then might well be...
Let's finish this post with the LoBAG diet. It's modest (20% of calories) in carbohydrate, has 30% of calories from protein and the rest as fat. It's being compared to a diet with similar carbohydrate content, 15% of calories from protein, with the rest as fat. Lots of details in here:
The metabolic response to a high-protein, low-carbohydrate diet in men with type 2 diabetes mellitus
As they say in the discussion:
"The present data indicate that the increase in IGF-1 is the result of the increase in protein content. The further decrease in carbohydrate did not result in a further increase in IGF-1. In fact, the increase was approximately the same (138% and 136%, respectively)".

What interested me initially (and had made me chase the paper) was the effect on GH itself. The LoBAG diet actually drops GH levels, admittedly by a ns amount. What turns out to be a much more interesting incidental finding is that, despite the downward trend in GH, IGF-1 rises by a statistically significantly and possibly by a biologically significant amount. Especially when you consider a whole slew of cancers sprout IGF-1 receptors on their surface.
Brief aside. You have to be very careful with GH and IGF-1 levels in papers like this one as both hormones come with a whole load of plasma binding proteins which very few people, including the LoBAG folks, ever measure. These may well alter the effective concentration of the hormone either upwards or downwards. Caution is needed with simple measurements like those in this paper. End aside.
So. Folks should eat whatever they feel comfortable with, protein-wise. I probably eat a little more protein than I would prefer, but then I'm no perfectionist. What I wouldn't do is to add protein gratuitously to any meal...
But that's just me I guess.
Peter
"On June 8th, 2003, the inaugural Methuselah Prize was awarded to Dr. Andrzej Bartke for the "Methuselah Mouse" that lived the equivalent of 180 human years".
You can read a bit more about growth hormone receptor knockout mice and other forms of dwarf mice in Dr Bartke's review, written soon after winning the prize:
Life extension in the dwarf mouse.
It's now 2018 and no one appears to have improved on the Laron mouse model which won that initial prize. Over the last 15 years there has been a lot of interesting research but no numerical progress. I think it is worth noting that Laron mice are not GH deficient, they have tons of the stuff. They simply do not have the receptor to do anything with it. Which, in particular, means they cannot generate IGF-1.
How do Laron humans fare? The best studied group live in Colombia. They're of very short stature. They have no recorded cases of diabetes and only one recorded cancer, which was non lethal*. Their every biochemical parameter is exemplary, especially insulin level and HOMA score. Do they all live to be centenarians? Apparently not. Being a dwarf in Columbia requires alcohol in large amounts to render life tolerable, plus accidental trauma is another huge problem. Quite what would happen if these people lived under similar conditions to the Laron mice in Dr Bartke's laboratory is a question which is unlikely ever to be answered! Longevity in the real world vs what works under ideal conditions...
*Dr Laron has reported two cases of Laron Syndrome people developing diabetes (and there are others), including the complications such as atherosclerosis, renal disease and diabetic retinopathy. This is an interesting observation and might be worth a post on its own some time.
There are tantalising suggestions from other GH modifying mutations in humans. One of the better studied of these is carried by the "Little people" of Krk in Croatia. More from Dr Laron:
Do deficiencies in growth hormone and insulin-like growth factor-1 (IGF-1) shorten or prolong longevity?
Longevity of the hypopituitary patients from the island Krk: a follow-up study
They have a mutation which causes multiple pituitary hormone deficits, ACTH secretion excepted. There are too few documented people with this genetic problem to say a great deal about longevity but ages of 68, 77, 83 and 91 years have been recorded in the four individuals to have died since detailed observations began. The equivalent syndrome in mice under lab conditions promotes longevity.
One of the nicer studies looking at human height (viewing this as a GH/IGF-1 signalling surrogate) and longevity is this one:
Shorter Men Live Longer: Association of Height with Longevity and FOXO3 Genotype in American Men of Japanese Ancestry
It found, as you might expect, an inverse relationship between height at enrolment and longevity. They also tied the relationship, observationally, to a down-regulating SNP of the FOXO3 gene, FOXO genes being major controllers of the insulin/IGF-1 signalling system.
Which genes you have is not under your control. What you do with then might well be...
Let's finish this post with the LoBAG diet. It's modest (20% of calories) in carbohydrate, has 30% of calories from protein and the rest as fat. It's being compared to a diet with similar carbohydrate content, 15% of calories from protein, with the rest as fat. Lots of details in here:
The metabolic response to a high-protein, low-carbohydrate diet in men with type 2 diabetes mellitus
As they say in the discussion:
"The present data indicate that the increase in IGF-1 is the result of the increase in protein content. The further decrease in carbohydrate did not result in a further increase in IGF-1. In fact, the increase was approximately the same (138% and 136%, respectively)".

What interested me initially (and had made me chase the paper) was the effect on GH itself. The LoBAG diet actually drops GH levels, admittedly by a ns amount. What turns out to be a much more interesting incidental finding is that, despite the downward trend in GH, IGF-1 rises by a statistically significantly and possibly by a biologically significant amount. Especially when you consider a whole slew of cancers sprout IGF-1 receptors on their surface.
Brief aside. You have to be very careful with GH and IGF-1 levels in papers like this one as both hormones come with a whole load of plasma binding proteins which very few people, including the LoBAG folks, ever measure. These may well alter the effective concentration of the hormone either upwards or downwards. Caution is needed with simple measurements like those in this paper. End aside.
So. Folks should eat whatever they feel comfortable with, protein-wise. I probably eat a little more protein than I would prefer, but then I'm no perfectionist. What I wouldn't do is to add protein gratuitously to any meal...
But that's just me I guess.
Peter
Sunday, December 24, 2017
Metformin (05) Insulin Resistance
Happy Christmas all. Would have been Happy Solstice but one of our cats died that day. Anyhoo.
Back to this image from the Japanese paper of the last post, open circles are without metformin, filled circles are the same people taking metformin 500mg tid.

If we initially look at the fasting values for the RQ we see 0.8 without medication and 0.77 under metformin, so adding in metformin gives an increase in fat oxidation. A very simple explanation for this is that, via metformin induced blockade of mitochondrial glycerol 3 phosphate dehydrogenase (mtG3Pdh), there is less glycolysis derived electron input at the CoQ couple, so it is less reduced and so there is less tendency for reverse electron transport through complex I. This generates less of the superoxide necessary to trigger the initiation of insulin signalling. The cells then behave as if there is even less insulin present than the 25pmol/l measured, so free fatty acids are more available for oxidation due to this reduced insulin signalling.
The simple concept is of metformin as "LC eating in a pill".
The fed state is altogether different and diametrically opposite. Insulin levels are between 100 and 200pmol/l. Under these conditions the RQ is significantly higher under metformin, an RQ of 0.8 vs the non medicated RQ of 0.76, present at the two hour mark with the differential maintained at three hours. Under these conditions metformin is facilitating the oxidation of glucose while there are calories in excess of immediate needs available, many of them from the butter in the cookies.
If we consider that blockade of mtG3Pdh should blunt insulin signalling we have a paradox that by one hour after a meal insulin signalling appears to have been facilitated and at hours two and three this reaches statistical (and probably biological) significance. So how can the one drug have opposite effects under differing conditions?
My suspicion is that the drug is doing the same thing at all times but that insulin is doing different things at different nutrient availabilities. Re consider this graph from this post:

The initial conclusion here was that metformin only facilitates blood glucose reduction in the presence of insulin. Metformin should, theoretically, blunt the action of insulin. But if we consider that at high levels of insulin the function of that insulin is to limit its own action, I think it would be much better viewed as metformin blunts insulin induced insulin resistance. Insulin was bolused iv at 90 minutes. It will have given a massively supra-physiological plasma level. Insulin induced insulin resistance in the insulin treated group appears to be absent at 30 minutes (ie 120 minutes on the graph), to have started at 60 minutes (150 minutes on the graph) and to have gotten p to below 0.05 at 90 minutes (180 minutes on the graph). Of course under an-insulinaemic conditions there is no insulin signalling to facilitate or block, hence the zero to 90 minutes on the graph where metformin has no effect on blood glucose before insulin was bolused.
From Ivor Cummings (not sure where I got the actual paper from) we have this concept:
Insulin is a stronger inducer of insulin resistance than hyperglycemia in mice with type 1 diabetes mellitus (T1DM)
Insulin is an effective inducer of insulin resistance. Working on the basis that insulin induced insulin resistance is triggered by "excessive" (ie physiologically appropriate to limit nutrient ingress under high calorie availability conditions) levels of superoxide generation then blockade of mtG3Pdh will reduce this "excessive" level of superoxide so defer the onset of insulin induced insulin resistance. This will allow on going utilisation of glucose post meal in the Japanese paper and post insulin bolus in the rodent study.
You just have to wonder whether metformin reduces hunger by blunting insulin signalling at adipocytes, so supplying more calories for the brain to sense or by facilitating the action of insulin within the brain so higher levels of insulin derived from eating absolute crap no longer induce CNS insulin resistance. Maybe both.
Oh, and if you facilitate glucose ingress in to cells when fatty acids are providing an already reduced electron transport chain you will clearly divert pyruvate to lactate rather than having it enter the mitochondria. Glycolysis without pyruvate oxidation gives lactate generation. Just like metformin does... and without needing complex I blockade concentrations. As the Japanese paper commented:
"Post-prandial plasma lactate concentration was significantly increased after the metformin treatment in both healthy subjects and diabetic patients".
Note that the effect was only present under high insulin levels post prandially when the normal physiological response is to shut down excess calorie ingress by inducing insulin resistance. Prevent this response and the calories enter cells as un-needed glucose and exit as "waste" lactate, minimising ATP generation.
Peter
Back to this image from the Japanese paper of the last post, open circles are without metformin, filled circles are the same people taking metformin 500mg tid.

If we initially look at the fasting values for the RQ we see 0.8 without medication and 0.77 under metformin, so adding in metformin gives an increase in fat oxidation. A very simple explanation for this is that, via metformin induced blockade of mitochondrial glycerol 3 phosphate dehydrogenase (mtG3Pdh), there is less glycolysis derived electron input at the CoQ couple, so it is less reduced and so there is less tendency for reverse electron transport through complex I. This generates less of the superoxide necessary to trigger the initiation of insulin signalling. The cells then behave as if there is even less insulin present than the 25pmol/l measured, so free fatty acids are more available for oxidation due to this reduced insulin signalling.
The simple concept is of metformin as "LC eating in a pill".
The fed state is altogether different and diametrically opposite. Insulin levels are between 100 and 200pmol/l. Under these conditions the RQ is significantly higher under metformin, an RQ of 0.8 vs the non medicated RQ of 0.76, present at the two hour mark with the differential maintained at three hours. Under these conditions metformin is facilitating the oxidation of glucose while there are calories in excess of immediate needs available, many of them from the butter in the cookies.
If we consider that blockade of mtG3Pdh should blunt insulin signalling we have a paradox that by one hour after a meal insulin signalling appears to have been facilitated and at hours two and three this reaches statistical (and probably biological) significance. So how can the one drug have opposite effects under differing conditions?
My suspicion is that the drug is doing the same thing at all times but that insulin is doing different things at different nutrient availabilities. Re consider this graph from this post:

The initial conclusion here was that metformin only facilitates blood glucose reduction in the presence of insulin. Metformin should, theoretically, blunt the action of insulin. But if we consider that at high levels of insulin the function of that insulin is to limit its own action, I think it would be much better viewed as metformin blunts insulin induced insulin resistance. Insulin was bolused iv at 90 minutes. It will have given a massively supra-physiological plasma level. Insulin induced insulin resistance in the insulin treated group appears to be absent at 30 minutes (ie 120 minutes on the graph), to have started at 60 minutes (150 minutes on the graph) and to have gotten p to below 0.05 at 90 minutes (180 minutes on the graph). Of course under an-insulinaemic conditions there is no insulin signalling to facilitate or block, hence the zero to 90 minutes on the graph where metformin has no effect on blood glucose before insulin was bolused.
From Ivor Cummings (not sure where I got the actual paper from) we have this concept:
Insulin is a stronger inducer of insulin resistance than hyperglycemia in mice with type 1 diabetes mellitus (T1DM)
Insulin is an effective inducer of insulin resistance. Working on the basis that insulin induced insulin resistance is triggered by "excessive" (ie physiologically appropriate to limit nutrient ingress under high calorie availability conditions) levels of superoxide generation then blockade of mtG3Pdh will reduce this "excessive" level of superoxide so defer the onset of insulin induced insulin resistance. This will allow on going utilisation of glucose post meal in the Japanese paper and post insulin bolus in the rodent study.
You just have to wonder whether metformin reduces hunger by blunting insulin signalling at adipocytes, so supplying more calories for the brain to sense or by facilitating the action of insulin within the brain so higher levels of insulin derived from eating absolute crap no longer induce CNS insulin resistance. Maybe both.
Oh, and if you facilitate glucose ingress in to cells when fatty acids are providing an already reduced electron transport chain you will clearly divert pyruvate to lactate rather than having it enter the mitochondria. Glycolysis without pyruvate oxidation gives lactate generation. Just like metformin does... and without needing complex I blockade concentrations. As the Japanese paper commented:
"Post-prandial plasma lactate concentration was significantly increased after the metformin treatment in both healthy subjects and diabetic patients".
Note that the effect was only present under high insulin levels post prandially when the normal physiological response is to shut down excess calorie ingress by inducing insulin resistance. Prevent this response and the calories enter cells as un-needed glucose and exit as "waste" lactate, minimising ATP generation.
Peter
Saturday, November 04, 2017
Metformin (04) Pre and Post Prandial
The next metformin paper to look at is this one:
Beneficial effects of metformin on energy metabolism and visceral fat volume through a possible mechanism of fatty acid oxidation in human subjects and rats
Here are the RQ data from 16 healthy humans after an overnight fast and for the three hours following a mixed carbohydrate/fat meal tolerance test (type of carbohydrate and fat not specified).
Aside: Here is the test "food" description: "meal tolerance tests (592 kcal, 75g of carbohydrate, 28.5g of fat; Saraya Co., Osaka, Japan)". It's great to know that there is a company called Saraya and that they have headquarters in Osaka. But I can't even find out what sort of "meals" Saraya make. Quite how anyone might replicate this study using the methods section is beyond me. In addition to these omissions the test "meal" is repeatedly described as "cookies". Go figure. Still, let's assume the measurements of RQ are numerically accurate, fingers crossed. End aside.
These healthy people, who haven't eaten overnight, have an RQ of 0.8 and the test meal produced a downward trend in RQ indicating that the "cookies", providing roughly 50% of calories as fat, tended to increase fatty acid oxidation or decrease carbohydrate oxidation. I can't be arsed to criticise their stats methods. Let's stick with the gross changes.
After two weeks on metformin at an eventual dose rate of 500mg three times daily there is a significant fall in fasting RQ indicating an increase in non-fed fat oxidation compared to the control state.
Under metformin the "cookies" produce a rising RQ, suggesting preferential metabolism of glucose in the immediate post prandial period.
So metformin promotes fat oxidation during fasting but promotes glucose oxidation during the first three hours after a plate of "cookies".
Interesting.
We should see if we can explain these effects on RQ in terms of mitochondrial glycerol-3-phosphate dehydrogenase (mtG3Pdh), electron transporting flavoprotein dehydrogenase (ETFdh) and the redox state of the CoQ couple driving reverse electron transport (RET) through complex I.
Peter
Beneficial effects of metformin on energy metabolism and visceral fat volume through a possible mechanism of fatty acid oxidation in human subjects and rats
Here are the RQ data from 16 healthy humans after an overnight fast and for the three hours following a mixed carbohydrate/fat meal tolerance test (type of carbohydrate and fat not specified).
Aside: Here is the test "food" description: "meal tolerance tests (592 kcal, 75g of carbohydrate, 28.5g of fat; Saraya Co., Osaka, Japan)". It's great to know that there is a company called Saraya and that they have headquarters in Osaka. But I can't even find out what sort of "meals" Saraya make. Quite how anyone might replicate this study using the methods section is beyond me. In addition to these omissions the test "meal" is repeatedly described as "cookies". Go figure. Still, let's assume the measurements of RQ are numerically accurate, fingers crossed. End aside.
These healthy people, who haven't eaten overnight, have an RQ of 0.8 and the test meal produced a downward trend in RQ indicating that the "cookies", providing roughly 50% of calories as fat, tended to increase fatty acid oxidation or decrease carbohydrate oxidation. I can't be arsed to criticise their stats methods. Let's stick with the gross changes.
After two weeks on metformin at an eventual dose rate of 500mg three times daily there is a significant fall in fasting RQ indicating an increase in non-fed fat oxidation compared to the control state.
Under metformin the "cookies" produce a rising RQ, suggesting preferential metabolism of glucose in the immediate post prandial period.
So metformin promotes fat oxidation during fasting but promotes glucose oxidation during the first three hours after a plate of "cookies".
Interesting.
We should see if we can explain these effects on RQ in terms of mitochondrial glycerol-3-phosphate dehydrogenase (mtG3Pdh), electron transporting flavoprotein dehydrogenase (ETFdh) and the redox state of the CoQ couple driving reverse electron transport (RET) through complex I.
Peter
Succinate doesn't drive reverse electron transport. Maybe.
Mike Eades sent me this paper:
Reactive oxygen species are generated by the respiratory complex II – evidence for lack of contribution of the reverse electron flow in
complex I
suggesting that RET through complex I, when driven by succinate oxidation at complex II, is a pure artefact of the pathologically high level of succinate used in the mitochondrial preparations involved. Bearing in mind that trying to work out exactly what the physiological concentration of succinate might be, in the region of the active site of a complex II in a working, oscillating, in-situ mitochondrion, involves an awful lot of guesswork.
However, the paper might well to be correct, within the limitations of the mitochondrial preparations they are using.
If you feed mitochondria with 5.0mmol/l succinate there is profuse ROS generation, 85% of which can be blocked by rotenone, ie this 85% is RET generated. The other 15% comes from other places, including complexes II and III, at least. But if you feed mitochondria with 0.5mmol/l succinate, or even 1.0mmol/l, there is no ROS generation at all. The case is made that ROS from RET are not a feature of "normal" levels of succinate driving the reduction of the CoQ couple.
Fine.
But this is a mitochondrial preparation. It has no cytoplasm, no glycolytic enzymes, no source of glycerol-3-phosphate, no FFAs, no carnitine. You can't buy a vial of FADH2 bound to electron transferring flavoprotein to feed in at ETFdh. This makes manipulating the CoQ couple in a way which is physiologically significant very difficult. In the current study we have no input to the CoQ couple other than complex II using succinate.
Those folks like myself, who feel that the redox state of the CoQ couple is the main sensor of the energy status of the cell, would never expect a single input in to the CoQ couple to be the sole representative of energy status. Even during glycolysis there is some fatty acid oxidation providing electron transferring flavoprotein to ETFdh. And succinate from FFA derived acetyl-CoA will also supply to complex II during lipid oxidation. And conversely some glycolysis will occur, even when FFA oxidation predominates, supplying glycerol-3-phosphate to mtG3Pdh.
Until we can set preparations up in which these inputs can be adjusted we are not able to say much about what might be happening in-vivo to RET. And once you start smashing the mitochondria to pieces and reassembling them as inside-out vesicles (so you can supply metabolites to the intra-mitochondria binding sites that would normally be hidden away from your extra-mitochondrial culture fluid) you are a very, very long way from in-vivo indeed.
Just saying...
Peter
Reactive oxygen species are generated by the respiratory complex II – evidence for lack of contribution of the reverse electron flow in
complex I
suggesting that RET through complex I, when driven by succinate oxidation at complex II, is a pure artefact of the pathologically high level of succinate used in the mitochondrial preparations involved. Bearing in mind that trying to work out exactly what the physiological concentration of succinate might be, in the region of the active site of a complex II in a working, oscillating, in-situ mitochondrion, involves an awful lot of guesswork.
However, the paper might well to be correct, within the limitations of the mitochondrial preparations they are using.
If you feed mitochondria with 5.0mmol/l succinate there is profuse ROS generation, 85% of which can be blocked by rotenone, ie this 85% is RET generated. The other 15% comes from other places, including complexes II and III, at least. But if you feed mitochondria with 0.5mmol/l succinate, or even 1.0mmol/l, there is no ROS generation at all. The case is made that ROS from RET are not a feature of "normal" levels of succinate driving the reduction of the CoQ couple.
Fine.
But this is a mitochondrial preparation. It has no cytoplasm, no glycolytic enzymes, no source of glycerol-3-phosphate, no FFAs, no carnitine. You can't buy a vial of FADH2 bound to electron transferring flavoprotein to feed in at ETFdh. This makes manipulating the CoQ couple in a way which is physiologically significant very difficult. In the current study we have no input to the CoQ couple other than complex II using succinate.
Those folks like myself, who feel that the redox state of the CoQ couple is the main sensor of the energy status of the cell, would never expect a single input in to the CoQ couple to be the sole representative of energy status. Even during glycolysis there is some fatty acid oxidation providing electron transferring flavoprotein to ETFdh. And succinate from FFA derived acetyl-CoA will also supply to complex II during lipid oxidation. And conversely some glycolysis will occur, even when FFA oxidation predominates, supplying glycerol-3-phosphate to mtG3Pdh.
Until we can set preparations up in which these inputs can be adjusted we are not able to say much about what might be happening in-vivo to RET. And once you start smashing the mitochondria to pieces and reassembling them as inside-out vesicles (so you can supply metabolites to the intra-mitochondria binding sites that would normally be hidden away from your extra-mitochondrial culture fluid) you are a very, very long way from in-vivo indeed.
Just saying...
Peter
Metformin (03) In-vivo experiments require non-lethal dose rates!
Just before I move on to metformin-induced substrate oxidation changes in healthy volunteers, I think it's worth looking at this neoplasia paper in a little detail. It's fairly typical of the work done on metformin as an anti-cancer agent and focuses on the highly reproducible inhibitory effect of metformin on complex I.
Metformin inhibits mitochondrial complex I of cancer cells to reduce tumorigenesis.
Most of this work is very clever and very carefully done, but lives with the problem that the experiments usually use concentrations of metformin in-vitro which would be lethal in-vivo because, well, everybody does it and there is no effect if you don't... However the mouse xenograft studies have to use clinically relevant therapeutic doses of metformin otherwise the mice would be, well, a bit dead. There are other problems which will become apparent as we work through the data.
The figure I'd like to focus on is supplementary data section three of figure seven.
Graphs B and C look like this:

This is what they did to generate them. They took A549 tumour cells and injected them in to immuno-incompetent mice then measured the growth of the resulting tumour. A549 cells are highly sensitive to metformin, so graph B comes as no surprise. Graph C is much, much cleverer. They wanted to prove that metformin was actually working on complex I. So they destroyed complex I with a shRNA targeting NDUSF3, an essential subunit of this complex. To keep the cell line functional they replaced complex I with our old friend the yeast derived NADH dehydrogenase NDI1. This enzyme does not bind metformin nor pump protons but does reduce NADH to NAD+ and does feed electrons to the CoQ couple and the downstream complexes. You can see from graph C that replacing complex I with NDI1 protects the A549 cell derived tumours from the growth slowing effects of metformin.
Look at B. Look at C. Protection from metformin in C. Yes?
Now, you have to ask: What is the effect of knocking down complex I in cancer cells? If you cannot reduce NADH to NAD+ then the TCA cannot turn. Citrate cannot be metabolised to alpha ketoglutarate so is exported from the mitochondria and can be used for tumour anabolism. The tumour becomes highly aggressive. Like this:
Down-Regulation of NDUFB9 Promotes Breast Cancer Cell Proliferation, Metastasis by Mediating Mitochondrial Metabolism
or this, blogged about many years ago:
Mitochondrial complex I activity and NAD+/NADH balance regulate breast cancer progression
This illustrates my marked discomfort with accepting complex I blockade as the mechanism of anti-cancer action of metformin. Blockading complex I will admittedly decrease ATP supply from oxidative phosphorylation but at the cost of supplying a large amount of citrate to the cytoplasm ready for anabolic processes, while glycolysis continues unabated, supplying cytoplasmic NADH and ATP.
So in the current paper, by knocking down NDUSF3, they should have generated an aggressive phenotype. They didn't, because they also engineered-in NDI1, which will reduce cytoplasmic NADH to NAD+ very effectively. Dropping the NADH to NAD+ ratio suppresses tumour aggressiveness in the above papers.
Does the engineered A549 NDUSF3 + NDI1 tumour in nude mice show reduced or increased aggressiveness compared to the A549 unmodified tumour? We are looking to compare the top line in graph B above (dark squares) with the pale squares in graph C. By eyeball they actually look pretty much the same.
Except for the x axes. Graph B is 40 weeks, graph C is 50 weeks. Hard to compare the two... But if we stretch graph C so that weeks 10-40 align with weeks 10-40 of graph B, then superimpose the two graphs we can generate the following, rather more informative, image:

It looks to me as if inserting NDI1 in to the mitochondria of a cell line, (probably) made aggressive by knockdown of NDUSF3, renders the in-vivo tumour growth rate much lower than the natural tumour cell line and remarkably similar to that of metformin treated natural tumour cell line. Probably by reducing the NADH:NAD+ ratio.
This doesn't automatically suggest that metformin might be acting by reducing the NADH:NAD+ ratio, though it might be, but it does illustrate how nicely you can still pull interesting snippets out of papers full of experiments with metformin at lethal concentrations.
The difference between isolated mitochondrial preparations and mouse models is that the mouse models have a supply of insulin, glycerol-3-phosphate and the enzyme to use cytoplasmic NADH to reduce the CoQ couple, facilitating insulin signalling and so cancer growth. This is much more likely to be the process which we can block with metformin at therapeutic concentrations.
Peter
Metformin inhibits mitochondrial complex I of cancer cells to reduce tumorigenesis.
Most of this work is very clever and very carefully done, but lives with the problem that the experiments usually use concentrations of metformin in-vitro which would be lethal in-vivo because, well, everybody does it and there is no effect if you don't... However the mouse xenograft studies have to use clinically relevant therapeutic doses of metformin otherwise the mice would be, well, a bit dead. There are other problems which will become apparent as we work through the data.
The figure I'd like to focus on is supplementary data section three of figure seven.
Graphs B and C look like this:

This is what they did to generate them. They took A549 tumour cells and injected them in to immuno-incompetent mice then measured the growth of the resulting tumour. A549 cells are highly sensitive to metformin, so graph B comes as no surprise. Graph C is much, much cleverer. They wanted to prove that metformin was actually working on complex I. So they destroyed complex I with a shRNA targeting NDUSF3, an essential subunit of this complex. To keep the cell line functional they replaced complex I with our old friend the yeast derived NADH dehydrogenase NDI1. This enzyme does not bind metformin nor pump protons but does reduce NADH to NAD+ and does feed electrons to the CoQ couple and the downstream complexes. You can see from graph C that replacing complex I with NDI1 protects the A549 cell derived tumours from the growth slowing effects of metformin.
Look at B. Look at C. Protection from metformin in C. Yes?
Now, you have to ask: What is the effect of knocking down complex I in cancer cells? If you cannot reduce NADH to NAD+ then the TCA cannot turn. Citrate cannot be metabolised to alpha ketoglutarate so is exported from the mitochondria and can be used for tumour anabolism. The tumour becomes highly aggressive. Like this:
Down-Regulation of NDUFB9 Promotes Breast Cancer Cell Proliferation, Metastasis by Mediating Mitochondrial Metabolism
or this, blogged about many years ago:
Mitochondrial complex I activity and NAD+/NADH balance regulate breast cancer progression
This illustrates my marked discomfort with accepting complex I blockade as the mechanism of anti-cancer action of metformin. Blockading complex I will admittedly decrease ATP supply from oxidative phosphorylation but at the cost of supplying a large amount of citrate to the cytoplasm ready for anabolic processes, while glycolysis continues unabated, supplying cytoplasmic NADH and ATP.
So in the current paper, by knocking down NDUSF3, they should have generated an aggressive phenotype. They didn't, because they also engineered-in NDI1, which will reduce cytoplasmic NADH to NAD+ very effectively. Dropping the NADH to NAD+ ratio suppresses tumour aggressiveness in the above papers.
Does the engineered A549 NDUSF3 + NDI1 tumour in nude mice show reduced or increased aggressiveness compared to the A549 unmodified tumour? We are looking to compare the top line in graph B above (dark squares) with the pale squares in graph C. By eyeball they actually look pretty much the same.
Except for the x axes. Graph B is 40 weeks, graph C is 50 weeks. Hard to compare the two... But if we stretch graph C so that weeks 10-40 align with weeks 10-40 of graph B, then superimpose the two graphs we can generate the following, rather more informative, image:

It looks to me as if inserting NDI1 in to the mitochondria of a cell line, (probably) made aggressive by knockdown of NDUSF3, renders the in-vivo tumour growth rate much lower than the natural tumour cell line and remarkably similar to that of metformin treated natural tumour cell line. Probably by reducing the NADH:NAD+ ratio.
This doesn't automatically suggest that metformin might be acting by reducing the NADH:NAD+ ratio, though it might be, but it does illustrate how nicely you can still pull interesting snippets out of papers full of experiments with metformin at lethal concentrations.
The difference between isolated mitochondrial preparations and mouse models is that the mouse models have a supply of insulin, glycerol-3-phosphate and the enzyme to use cytoplasmic NADH to reduce the CoQ couple, facilitating insulin signalling and so cancer growth. This is much more likely to be the process which we can block with metformin at therapeutic concentrations.
Peter
Wednesday, August 02, 2017
Metformin (02) The dose makes the poison
Before the days of interest in metformin as an anti-neoplastic agent, a performance enhancing drug or a longevity promoter, it was just given to T2DM patients to help lower blood glucose levels. These folks, as a group, quite often have significant renal disease. Which can render metformin and lactate cumulative in the blood stream and lead to a life threatening lactic acidosis.
This paper looked at a series of 10 hapless folk to whom this happened:
Metformin overdose causes platelet mitochondrial dysfunction in humans
The mean blood concentration which gets you an ITU bed was 32mg/l. Now this is a clinical paper, written by clinicians. Nothing wrong with that, except they use Noddy units which makes the metformin concentrations extremely difficult to relate to the vast body of metformin research, which uses units of millimolar or micromolar.
So we really need to take this image

and think of it in these terms when we're looking at research papers using mmol or micromol concentrations:

Bear in mind that these are very chronic exposure values and metformin is thought to be progressively cumulative within the mitochondria on chronic exposure. Of course, complex I is intra mitochondrial and there will be some dependency on cumulation in getting significant effects at this site. What we can say is that, in the above diagram, there is not enough inhibition of complex I to raise lactate production in platelets, an extra-hepatic tissue (hepatocytes may be slightly different), unless we are using near-death concentrations.
What is not hidden away inside the mitochondrial matrix is mtG3Pdh. It's on the outer surface of the inner mitochondrial membrane and will be exposed to whatever metformin concentration that manages to get inside the cell.
From the classic paper
Metformin suppresses gluconeogenesis by inhibiting mitochondrial glycerophosphate dehydrogenase
we have this graph from Figure 3, using a slurry of mashed up mitochondria and some glycerol phosphate:

Here we have a significant effect on the oxidation of glycerol-3-phosphate at micromolar concentrations. Admittedly by 50μmol we are looking at very much the upper end of therapeutic concentrations but an effect is clearly visible at this level. We can say from the platelet paper that exposure to 250μmol (black circles at the bottom of the graph), if sustained, will put you in the ITU with potentially fatal lactic acidosis.
Because mtG3Pdh is exposed to cytoplasmic (non cumulative vs mitochondrial) metformin levels it will see the drug at plasma concentrations (or slightly less) and it will see these concentrations as soon as metformin enters the blood stream.
If you want a performance enhancing drug for endurance exercise, say a cycle race taking about three hours, you can pop a single metformin 500mg tablet before the start of the race and extend your time to exhaustion in a final sprint from 167 seconds to 191 seconds. That might make some difference to winning vs not winning.
Metformin improves performance in high-intensity exercise, but not anaerobic capacity in healthy male subjects
Equally, there is no acute effect on lactate levels in the same study. This is no surprise as I find it difficult to envisage acute complex I blockade, to lactate generating levels, as a performance enhancing ploy.
TLDR: metformin probably works in the cytolasm on mtG3Pdh. Rising lactate may well indicate mitochondrial cumulation and some degree of complex I inhibition. Extrapolating benefits from studies based around millimolar concentrations in-vitro may well put you in to the ITU if you try them in-vivo.
Peter
This paper looked at a series of 10 hapless folk to whom this happened:
Metformin overdose causes platelet mitochondrial dysfunction in humans
The mean blood concentration which gets you an ITU bed was 32mg/l. Now this is a clinical paper, written by clinicians. Nothing wrong with that, except they use Noddy units which makes the metformin concentrations extremely difficult to relate to the vast body of metformin research, which uses units of millimolar or micromolar.
So we really need to take this image

and think of it in these terms when we're looking at research papers using mmol or micromol concentrations:

Bear in mind that these are very chronic exposure values and metformin is thought to be progressively cumulative within the mitochondria on chronic exposure. Of course, complex I is intra mitochondrial and there will be some dependency on cumulation in getting significant effects at this site. What we can say is that, in the above diagram, there is not enough inhibition of complex I to raise lactate production in platelets, an extra-hepatic tissue (hepatocytes may be slightly different), unless we are using near-death concentrations.
What is not hidden away inside the mitochondrial matrix is mtG3Pdh. It's on the outer surface of the inner mitochondrial membrane and will be exposed to whatever metformin concentration that manages to get inside the cell.
From the classic paper
Metformin suppresses gluconeogenesis by inhibiting mitochondrial glycerophosphate dehydrogenase
we have this graph from Figure 3, using a slurry of mashed up mitochondria and some glycerol phosphate:

Here we have a significant effect on the oxidation of glycerol-3-phosphate at micromolar concentrations. Admittedly by 50μmol we are looking at very much the upper end of therapeutic concentrations but an effect is clearly visible at this level. We can say from the platelet paper that exposure to 250μmol (black circles at the bottom of the graph), if sustained, will put you in the ITU with potentially fatal lactic acidosis.
Because mtG3Pdh is exposed to cytoplasmic (non cumulative vs mitochondrial) metformin levels it will see the drug at plasma concentrations (or slightly less) and it will see these concentrations as soon as metformin enters the blood stream.
If you want a performance enhancing drug for endurance exercise, say a cycle race taking about three hours, you can pop a single metformin 500mg tablet before the start of the race and extend your time to exhaustion in a final sprint from 167 seconds to 191 seconds. That might make some difference to winning vs not winning.
Metformin improves performance in high-intensity exercise, but not anaerobic capacity in healthy male subjects
Equally, there is no acute effect on lactate levels in the same study. This is no surprise as I find it difficult to envisage acute complex I blockade, to lactate generating levels, as a performance enhancing ploy.
TLDR: metformin probably works in the cytolasm on mtG3Pdh. Rising lactate may well indicate mitochondrial cumulation and some degree of complex I inhibition. Extrapolating benefits from studies based around millimolar concentrations in-vitro may well put you in to the ITU if you try them in-vivo.
Peter
Tuesday, July 25, 2017
Metformin (01) Insulin
This image is taken from the paper Insulin requirement for the antihyperglycaemic effect of metformin and it deserves a little consideration.
They are using BB/S rats which spontaneously develop T1DM if fed standard rodent chow. In the absence of exogenous insulin they die but giving them a little Ultratard twice daily keeps them alive for quite some time. Stopping the Ultratard allows exogenous insulin withdrawal to produce an acute, alive, an-insulinaemic rodent model. This is the model used and at the start of this experiment the rats had no detectable insulin in their blood.
At time point -60 these an-insulinaemic rats were given metformin intrajejunally. Over the next 60 minutes the metformin did nothing to lower plasma glucose. At time point zero they were given a small intravenous bolus of glucose. Metformin had no effect on the additional hyperglycaemia induced.
At time point +90 they were given neutral insulin intravenously. In the control group plasma glucose concentration dropped to a nadir of 20mmol/l at time point +150 but in the metformin treated rats the same dose of insulin continued to reduce the plasma glucose to 10mmol/l at time point +180, when p dropped below 0.05.
So.
Insulin is essential to demonstrate any effect of metformin on blood glucose.
Any idea about how metformin works, be that via the inhibition of mtG3Pdh or via inhibition of complex I, has to accommodate the essentiality of insulin.
That's an interesting constraint.
Peter
They are using BB/S rats which spontaneously develop T1DM if fed standard rodent chow. In the absence of exogenous insulin they die but giving them a little Ultratard twice daily keeps them alive for quite some time. Stopping the Ultratard allows exogenous insulin withdrawal to produce an acute, alive, an-insulinaemic rodent model. This is the model used and at the start of this experiment the rats had no detectable insulin in their blood.
At time point -60 these an-insulinaemic rats were given metformin intrajejunally. Over the next 60 minutes the metformin did nothing to lower plasma glucose. At time point zero they were given a small intravenous bolus of glucose. Metformin had no effect on the additional hyperglycaemia induced.
At time point +90 they were given neutral insulin intravenously. In the control group plasma glucose concentration dropped to a nadir of 20mmol/l at time point +150 but in the metformin treated rats the same dose of insulin continued to reduce the plasma glucose to 10mmol/l at time point +180, when p dropped below 0.05.
So.
Insulin is essential to demonstrate any effect of metformin on blood glucose.
Any idea about how metformin works, be that via the inhibition of mtG3Pdh or via inhibition of complex I, has to accommodate the essentiality of insulin.
That's an interesting constraint.
Peter
Monday, July 24, 2017
An update
Hi All.
We've moved house. It has not been the simplest of moves. OK, it was awful. However it was also worth it as we live here now.

While the house is in pretty good order the acre and a half of ground needs some TLC before we can get the chickens strip grazing and maybe some stock in, so I sort of doubt there will be a huge amount of free time to blog. Maybe a little musing on metformin might be possible...
Anyway, we're alive and busy and now live some distance from the nearest main road (in Norfolk terms).
Peter
We've moved house. It has not been the simplest of moves. OK, it was awful. However it was also worth it as we live here now.

While the house is in pretty good order the acre and a half of ground needs some TLC before we can get the chickens strip grazing and maybe some stock in, so I sort of doubt there will be a huge amount of free time to blog. Maybe a little musing on metformin might be possible...
Anyway, we're alive and busy and now live some distance from the nearest main road (in Norfolk terms).
Peter
Saturday, June 03, 2017
Why stop at formaldehyde?
If we consider the dissociation of hydrogen:

the right hand side of the equation can supply electrons to another reaction. The tendency for this to occur is in part dependent on the pH of the solution. If we consider alkaline hydrothermal vents we have a pH of around 11, this drives the reaction to the right because the protons avidly combine with hydroxyl ions to give water:

Which means that there is a marked tendency to supply electrons for any electron-accepting reaction. The electrons can hop on to an FeS barrier (each changing the charge on an Fe from 3+ to 2+) which separates the vent fluid from CO2 rich, acidic oceanic water:

Deriving from fluid with a pH of 11 these electrons have a redox potential of -650mV, ie they are highly reducing.
If we now look at the situation on the oceanic side of the barrier we have:

and by adding on the factor of an acidic pH, with lots of protons driving the reaction to the right we have this:
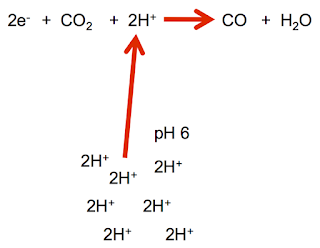
Under these conditions electrons supplied at -650mV are very able to allow the reaction to proceed to the right yielding CO. Repeating the process yields CH2O and metabolism is on its way.

OK. Nick Lane makes these points in his paper:
1. There is no contact between the H2 in the vent fluid and the CO2 in the ocean fluid. The two Hs in the formaldehyde come from oceanic protons combining with vent H2 derived electrons.
2. I've shown the reaction occurring once to CO and again to CH2O. Why stop at twice? Given a supply of -650mV electrons why not keep generating CO and inserting it, along with e- and H+, in to whatever hydrocarbon you have already got in the vent fluid? Nick Lane has reaction sketches for generating almost all of the Krebs cycle components on this basis.
Theoretically, if you wanted to make an origin of life reactor to test whether you can generate a multitude of the hydrocarbons at the core of metabolism you don't actually need a supply of alkaline hydrogen rich fluid. This only supplies electrons at -650mV. An alternative supply would be a 1.5 volt battery with some sort of voltage reduction to get from -1500mV to -650mv and you're away.
A microporous FeS electrode in Perrier water, energised by an AA battery via a couple of resistors and you might just be set up. Getting the apparatus anoxic and detecting the products might be more of a challenge!
Edit Finally followed Nick Lane's final reference. These folks have reached pyruvate via an energised FeS electrode. It's a lot more complex than Perrier water but it works. End edit
Peter

the right hand side of the equation can supply electrons to another reaction. The tendency for this to occur is in part dependent on the pH of the solution. If we consider alkaline hydrothermal vents we have a pH of around 11, this drives the reaction to the right because the protons avidly combine with hydroxyl ions to give water:

Which means that there is a marked tendency to supply electrons for any electron-accepting reaction. The electrons can hop on to an FeS barrier (each changing the charge on an Fe from 3+ to 2+) which separates the vent fluid from CO2 rich, acidic oceanic water:

Deriving from fluid with a pH of 11 these electrons have a redox potential of -650mV, ie they are highly reducing.
If we now look at the situation on the oceanic side of the barrier we have:

and by adding on the factor of an acidic pH, with lots of protons driving the reaction to the right we have this:

Under these conditions electrons supplied at -650mV are very able to allow the reaction to proceed to the right yielding CO. Repeating the process yields CH2O and metabolism is on its way.

OK. Nick Lane makes these points in his paper:
1. There is no contact between the H2 in the vent fluid and the CO2 in the ocean fluid. The two Hs in the formaldehyde come from oceanic protons combining with vent H2 derived electrons.
2. I've shown the reaction occurring once to CO and again to CH2O. Why stop at twice? Given a supply of -650mV electrons why not keep generating CO and inserting it, along with e- and H+, in to whatever hydrocarbon you have already got in the vent fluid? Nick Lane has reaction sketches for generating almost all of the Krebs cycle components on this basis.
Theoretically, if you wanted to make an origin of life reactor to test whether you can generate a multitude of the hydrocarbons at the core of metabolism you don't actually need a supply of alkaline hydrogen rich fluid. This only supplies electrons at -650mV. An alternative supply would be a 1.5 volt battery with some sort of voltage reduction to get from -1500mV to -650mv and you're away.
A microporous FeS electrode in Perrier water, energised by an AA battery via a couple of resistors and you might just be set up. Getting the apparatus anoxic and detecting the products might be more of a challenge!
Edit Finally followed Nick Lane's final reference. These folks have reached pyruvate via an energised FeS electrode. It's a lot more complex than Perrier water but it works. End edit
Peter
Thursday, June 01, 2017
Nick Lane on Proto-Ech
Nick Lane has a few more downloadable papers available on his website, two of which focus on ideas I've thought a lot about. Here are a few quotes:
Iron Catalysis at the Origin of Life
"Why does the reduction of ferredoxin via Ech depend on the proton-motive force? The answer is as yet unknown, but cannot relate to reverse electron flow [as originally proposed (49)] as these methanogens do not possess an electron-transport chain (37,38). A more pleasing possibility is that pH modulates reduction potential at the active site of the enzyme. The flux of protons through Ech from the relatively acidic exterior could lower the pH at the active site of the enzyme, which should facilitate reductions that depend on protons, including CO2 as well as some ferredoxins (50)".
My italics. Next:
Proton gradients at the origin of life
Aside: If you read the full text of Lane's paper you will take note of Jackson JB (2016) Natural pH gradients in hydrothermal alkali vents were unlikely to have played a role in the origin of life. And this passed scrutineering. Nick Lane does not seem impressed. End aside.
"One possibility is that prebiotic carbon and energy metabolism entailed the synthesis of reactive thioesters analogous to acetyl CoA, such as methyl thioacetate, coupled to substrate-level phosphorylation, generating acetyl phosphate and ultimately ATP [1, 17, 27, 60–63] as still happens in bacteria [14, 31]".
"Across the barrier, in acidic conditions, CO2 is more easily reduced, and so is more likely to be reduced by Fe2+ in the barrier. The semiconducting barrier should transfer electrons from Fe2+ on the alkaline side to Fe3+ on the acidic side. The thickness of the barrier does not matter, so long as it is semiconducting. The two phases do not come into direct contact - H2 and CO2 do not react directly (Fig. 3)".
This is really neat, it puts in to a published paper many of the logical concepts that went in to the Life series. I really like the pre biotic ideas of electron transfer across any-thickness FeS barriers. No need for membranes, indeed insulating "crud" membranes would hinder electron transfer from the FeS wall to the enzyme, necessitating the generation of a pore like structure (ancestor to NuoH) to get the voltage generating acidic pH to the active enzyme's site.
This ferredoxin reduction plus subsequent substrate-level phosphorylation is where it should all start. NuoH starts as a pH channel, not part of a nano machine. That comes later with reversal of proton flow and the development of complex I, a true advanced nano machine.
I still don't buy ATP synthase (another very complex nano machine) as running on the primordial vent proton gradient as Nick Lane holds to. Later developing Na+ energetics look much more likely, these following on from Proto-Ech's pore duplication to form a Na+/H+ antiporter, giving a usable Na+ gradient. That clearly post-dates some sort of membrane, which ferredoxin based metabolism must precede when using a geochemical proton gradient. NuoH becomes essential only after a crude membrane forms to impede this process of ferredoxin reduction.
Nice papers.
Peter
Iron Catalysis at the Origin of Life
"Why does the reduction of ferredoxin via Ech depend on the proton-motive force? The answer is as yet unknown, but cannot relate to reverse electron flow [as originally proposed (49)] as these methanogens do not possess an electron-transport chain (37,38). A more pleasing possibility is that pH modulates reduction potential at the active site of the enzyme. The flux of protons through Ech from the relatively acidic exterior could lower the pH at the active site of the enzyme, which should facilitate reductions that depend on protons, including CO2 as well as some ferredoxins (50)".
My italics. Next:
Proton gradients at the origin of life
Aside: If you read the full text of Lane's paper you will take note of Jackson JB (2016) Natural pH gradients in hydrothermal alkali vents were unlikely to have played a role in the origin of life. And this passed scrutineering. Nick Lane does not seem impressed. End aside.
"One possibility is that prebiotic carbon and energy metabolism entailed the synthesis of reactive thioesters analogous to acetyl CoA, such as methyl thioacetate, coupled to substrate-level phosphorylation, generating acetyl phosphate and ultimately ATP [1, 17, 27, 60–63] as still happens in bacteria [14, 31]".
"Across the barrier, in acidic conditions, CO2 is more easily reduced, and so is more likely to be reduced by Fe2+ in the barrier. The semiconducting barrier should transfer electrons from Fe2+ on the alkaline side to Fe3+ on the acidic side. The thickness of the barrier does not matter, so long as it is semiconducting. The two phases do not come into direct contact - H2 and CO2 do not react directly (Fig. 3)".
This is really neat, it puts in to a published paper many of the logical concepts that went in to the Life series. I really like the pre biotic ideas of electron transfer across any-thickness FeS barriers. No need for membranes, indeed insulating "crud" membranes would hinder electron transfer from the FeS wall to the enzyme, necessitating the generation of a pore like structure (ancestor to NuoH) to get the voltage generating acidic pH to the active enzyme's site.
This ferredoxin reduction plus subsequent substrate-level phosphorylation is where it should all start. NuoH starts as a pH channel, not part of a nano machine. That comes later with reversal of proton flow and the development of complex I, a true advanced nano machine.
I still don't buy ATP synthase (another very complex nano machine) as running on the primordial vent proton gradient as Nick Lane holds to. Later developing Na+ energetics look much more likely, these following on from Proto-Ech's pore duplication to form a Na+/H+ antiporter, giving a usable Na+ gradient. That clearly post-dates some sort of membrane, which ferredoxin based metabolism must precede when using a geochemical proton gradient. NuoH becomes essential only after a crude membrane forms to impede this process of ferredoxin reduction.
Nice papers.
Peter
Tuesday, May 30, 2017
Adrian Ballinger on Everest
Back at the end of 2015 Mike Brampton and I had a conversation about climbing Everest.
Based on Graph A from Fig 3 in D'Agostino's rat paper
Therapeutic ketosis with ketone ester delays central nervous system oxygen toxicity seizures in rats
our conclusion was that summiting Everest might be best achieved using a ketogenic diet. I know nothing about extreme climbing or the culture which goes with it but it came as no surprise, via Mike, that they carb loaded and carb loaded and carb loaded. You know, sugar has its own partial oxygen supply built in to the molecule. No point trying to burn fat if there's no oxygen*. Understandable but, obviously, completely incorrect. I think Mike had been trying (frustratedly) to convert altitude folks to fat centred thinking for some years before this.
*It's true that there is no point trying to burn fat under anoxia. But given some oxygen ketosis pays dividends.
So it was interesting to pick up this link on Facebook:
How Adrian Ballinger Summited Everest Without Oxygen
This fits in with Veech's concept of increased metabolic efficiency per unit O2 consumed when burning ketones and D'Agostino's discovery of an "unexpected" rise in arterial PO2 in rats gavaged with a betahydroxybutyrate/acetoacetate combination precursor, while they were breathing room air (PaO2 from 100mmHg to 130mmHg, pardon the archaic units).
Very gratifying, even if completely different from the approach taken by Naked Mole Rats and their fructolysis.
Peter
Based on Graph A from Fig 3 in D'Agostino's rat paper
Therapeutic ketosis with ketone ester delays central nervous system oxygen toxicity seizures in rats
our conclusion was that summiting Everest might be best achieved using a ketogenic diet. I know nothing about extreme climbing or the culture which goes with it but it came as no surprise, via Mike, that they carb loaded and carb loaded and carb loaded. You know, sugar has its own partial oxygen supply built in to the molecule. No point trying to burn fat if there's no oxygen*. Understandable but, obviously, completely incorrect. I think Mike had been trying (frustratedly) to convert altitude folks to fat centred thinking for some years before this.
*It's true that there is no point trying to burn fat under anoxia. But given some oxygen ketosis pays dividends.
So it was interesting to pick up this link on Facebook:
How Adrian Ballinger Summited Everest Without Oxygen
This fits in with Veech's concept of increased metabolic efficiency per unit O2 consumed when burning ketones and D'Agostino's discovery of an "unexpected" rise in arterial PO2 in rats gavaged with a betahydroxybutyrate/acetoacetate combination precursor, while they were breathing room air (PaO2 from 100mmHg to 130mmHg, pardon the archaic units).
Very gratifying, even if completely different from the approach taken by Naked Mole Rats and their fructolysis.
Peter
Fructose and lactic acid in Naked Mole Rats
Naked Mole Rats appear to use fructose as their preferred metabolic substrate when exposed to both physiological hypoxia (which is common in their lifestyle) or complete anoxia under experimental conditions. It's irresistible to go and find out a little about why they might do this.
Fructose-driven glycolysis supports anoxia resistance in the naked mole-rat
I suppose the first thing to say is that the fact that fructose is protective against hypoxic cellular injury has been known for a long time, this paper coms from 1992:
Fructose protects rat hepatocytes from anoxic injury. Effect on intracellular ATP, Ca2+i, Mg2+i, Na+i, and pHi
There was a lot of work done in the 1980s and 90s looking at ways of preserving liver cells under anoxia. I'd guess this was looking to improve the survival of harvested livers within the transplant program.
If we look at ATP levels compared to an externally supplied control (MDPA) we have this graph, with hypoxia imposed at one hour and relieved at three hours:

ATP falls faster within the first 30 minutes of anoxia with fructose. Although the trends are interesting, all else is ns after 45 minutes. So fructose causes a more severe ATP depletion than glucose. However a better marker is the ratio of ATP to Pi (phosphorylation potential), here plotted as the inverse for some reason, ie the lower the better in the graph:

So under fructose there is less ATP in the cytoplasm than under glucose but the phosphate level is even lower, giving a similar or more favourable ratio of ATP to Pi except at the 30 minute mark. So the next question is: Where has the phosphate gone?
This might be related to the protective effect of cytoplasmic acidosis. It doesn't seem to matter how you acidify the cytoplasm (fructose is as good a way as any), it's the acidosis which appears to protect against mitochondrial failure. There's a nice paper here
Protection by acidotic pH and fructose against lethal injury to rat hepatocytes from mitochondrial inhibitors, ionophores and oxidant chemicals
and here
Intracellular acidosis protects cultured hepatocytes from the toxic consequences of a loss of mitochondrial energization
So if we go back to Gasbarrini's paper we can look at a surrogate for intracellular pH and how it differs between fructose and glucose:

Fructose produces a much more profound acidosis. If we look at that basic ETC doodle I used in the rho zero cell post, but eliminate complexes I, II, III and IV we have this:

We have here two process which can be driven by an excess of protons in the cytoplasm over those in the mitochondrial matrix. Transport of Pi in to the mitochondria and synthesis of ATP. Which of these is most important to ensure cell survival is hard to say. It is even quite possible that it's neither and that maintaining an excess of protons outside the mitochondria maintains delta psi so defers the commitment to apoptosis or the occurrence of necrosis.
Later changes which confirm the commitment to cell death are an influx of extracellular calcium in to the cytoiplasm. This is marked under glucose and stays within tolerable limits with fructose. I strongly suspect the metabolic decision making is being controlled by the pH drop and the Ca2+ influx is consequent to a mitochondrial decision as to how badly damaged the cell might be. But it's hard to be sure with the data we have in these rather elderly papers.
About that acidosis:
Here are the reactions relevant to the pH change in lactic acidosis, all taken from the wiki entry on lactic acid. They are interesting. This is the situation down to pyruvate:

There are two protons generated to acidify the cytoplasm. Now look at this step where pyruvate is converted to lactate. The molecules in the red oval are needed to form the lactate.

So where did the two acidifying protons go to? They are consumed in converting pyruvate to lactate. Does lactic acid generation actually acidify the cytoplasm? It appears not to do so here but it must do because the overall reaction is:

So where are these two protons? They are in the two ATP molecules:

The conversion of ATP to ADP releases them. So lactate causes acidosis only when the ATP generated during glycolysis/fructolysis is consumed... Obviously ATP depletion is common in anaerobic exercise or hypoxia/anoxia. Hence lactic acidosis shows under these two conditions.
The Naked Mole Rat paper is very descriptive, with lots of experimental results but is light on insight as to hows and whys. I think the above scenario might well have explanatory power and might have been extended from the liver to the rest of the body in NMRs.
Peter
Fructose-driven glycolysis supports anoxia resistance in the naked mole-rat
I suppose the first thing to say is that the fact that fructose is protective against hypoxic cellular injury has been known for a long time, this paper coms from 1992:
Fructose protects rat hepatocytes from anoxic injury. Effect on intracellular ATP, Ca2+i, Mg2+i, Na+i, and pHi
There was a lot of work done in the 1980s and 90s looking at ways of preserving liver cells under anoxia. I'd guess this was looking to improve the survival of harvested livers within the transplant program.
If we look at ATP levels compared to an externally supplied control (MDPA) we have this graph, with hypoxia imposed at one hour and relieved at three hours:

ATP falls faster within the first 30 minutes of anoxia with fructose. Although the trends are interesting, all else is ns after 45 minutes. So fructose causes a more severe ATP depletion than glucose. However a better marker is the ratio of ATP to Pi (phosphorylation potential), here plotted as the inverse for some reason, ie the lower the better in the graph:

So under fructose there is less ATP in the cytoplasm than under glucose but the phosphate level is even lower, giving a similar or more favourable ratio of ATP to Pi except at the 30 minute mark. So the next question is: Where has the phosphate gone?
This might be related to the protective effect of cytoplasmic acidosis. It doesn't seem to matter how you acidify the cytoplasm (fructose is as good a way as any), it's the acidosis which appears to protect against mitochondrial failure. There's a nice paper here
Protection by acidotic pH and fructose against lethal injury to rat hepatocytes from mitochondrial inhibitors, ionophores and oxidant chemicals
and here
Intracellular acidosis protects cultured hepatocytes from the toxic consequences of a loss of mitochondrial energization
So if we go back to Gasbarrini's paper we can look at a surrogate for intracellular pH and how it differs between fructose and glucose:

Fructose produces a much more profound acidosis. If we look at that basic ETC doodle I used in the rho zero cell post, but eliminate complexes I, II, III and IV we have this:

We have here two process which can be driven by an excess of protons in the cytoplasm over those in the mitochondrial matrix. Transport of Pi in to the mitochondria and synthesis of ATP. Which of these is most important to ensure cell survival is hard to say. It is even quite possible that it's neither and that maintaining an excess of protons outside the mitochondria maintains delta psi so defers the commitment to apoptosis or the occurrence of necrosis.
Later changes which confirm the commitment to cell death are an influx of extracellular calcium in to the cytoiplasm. This is marked under glucose and stays within tolerable limits with fructose. I strongly suspect the metabolic decision making is being controlled by the pH drop and the Ca2+ influx is consequent to a mitochondrial decision as to how badly damaged the cell might be. But it's hard to be sure with the data we have in these rather elderly papers.
About that acidosis:
Here are the reactions relevant to the pH change in lactic acidosis, all taken from the wiki entry on lactic acid. They are interesting. This is the situation down to pyruvate:

There are two protons generated to acidify the cytoplasm. Now look at this step where pyruvate is converted to lactate. The molecules in the red oval are needed to form the lactate.

So where did the two acidifying protons go to? They are consumed in converting pyruvate to lactate. Does lactic acid generation actually acidify the cytoplasm? It appears not to do so here but it must do because the overall reaction is:

So where are these two protons? They are in the two ATP molecules:

The conversion of ATP to ADP releases them. So lactate causes acidosis only when the ATP generated during glycolysis/fructolysis is consumed... Obviously ATP depletion is common in anaerobic exercise or hypoxia/anoxia. Hence lactic acidosis shows under these two conditions.
The Naked Mole Rat paper is very descriptive, with lots of experimental results but is light on insight as to hows and whys. I think the above scenario might well have explanatory power and might have been extended from the liver to the rest of the body in NMRs.
Peter
Thursday, May 18, 2017
Fructose and metabolic syndrome: Uric acid
Some weeks ago a friend sent me a full text copy of the Naked Mole Rats (NMR) paper
Fructose-driven glycolysis supports anoxia resistance in the naked mole-rat
which demonstrated that they (NMRs) appear to generate and use fructose as a coping stratagem for dealing with hypoxia or even anoxia. This is fascinating and leads back to research in the late 1980s, mostly looking at anoxia in liver or liver cells. I'm guessing that this liver work was funded to look at ways of improving the condition of transplant grafts. Fructose is significantly better than glucose for supporting anoxic liver cells, possibly something you might expect, possibly not. Perhaps in another post.
Anyway. So I've been looking at why fructose is different to glucose and to do this you end up asking rather difficult questions about the upper sections of both glycolysis and fructolysis.
Fructose enters the fructolytic pathway by being phosphorylated very rapidly to fructose-1-phosphate. Given a large enough supply of fructose this phosphorylation can deplete the ATP supply in a cell, most obviously in hepatocytes which bear the brunt of metabolising fructose. This takes place before aldolase generates the trioses which probably (or don't, in the case of fructose) control insulin signalling through mtG3Pdh and the glycerophosphate shuttle.
If this initial ATP depletion by fructokinase is profound it is perfectly possible to take two "waste" ADP molecules and transfer a phosphate from one to the other. This generates one ATP and one AMP. The ATP is useful to the cell and the excess AMP is degraded to uric acid.
This is all basic biochemistry.
In the Protons series I have worked on the (incorrect) basis that fructose should drive the glycerophosphate shuttle hard enough to generate RET (reverse electron transport) and so signal insulin resistance. The degree of insulin resistance should neatly reduce insulin mediated glucose supply by an appropriate amount to offset the fructose and so maintain a stable flux of ATP generation from the combined fructose and glucose. That's not quite how it appears to work. Even before the aldolase step in fructolysis, the body is starting to prepare the process of insulin resistance. This paper is not unique but shows general principles:
Uric acid induces hepatic steatosis by generation of mitochondrial oxidative stress: potential role in fructose-dependent and -independent fatty liver
The title of the paper is sneaky, it doesn't give away the answer! Nor does the abstract. If you don't want to read the paper, the missing link is NOX4.
NADPH oxidase 4 (NOX4), if exposed to uric acid (present here from fructolysis induced AMP degradation), translocates to the mitochondria and starts to generate enough hydrogen peroxide* to down regulate aconitase, abort the TCA and divert citrate out of the mitochondria through the citrate/malate shuttle for DNL. This will not just affect fructose metabolism, acetyl-CoA from glucose, entering the TCA as citrate, will also be diverted to DNL.
*The NOX family appear to be the only enzymes with no function other than to produce ROS, mostly superoxide. NOX4 is unique in that it always produces hydrogen peroxide. There is uncertainty if the "E loop" of the enzyme converts superoxide to hydrogen peroxide directly or if this is a docking site for superoxide dismutase, which does the conversion as an accessory module to NOX4.
I think it is a reasonable assumption that the hydrogen peroxide generated by NOX4 will be what signals the insulin resistance induced by fructose, rather than RET via mtG3Pdh. Quite why fructose doesn't drive the glycerophosphate shuttle is a difficult question to answer. Obviously the aldolase products of fructose-1-P (fructolysis) differ from those of fructose-1-6-bisphosphate (glycolysis) but these pathways are very difficult to get at experimentally and I've not found any papers looking at what controls why dihydroxyacetone phosphate from fructolysis doesn't drive mtG3Pdh, but that appears to be the case. There are hints that some activation of the glycerophosphate shuttle does occur but NOX4 seems to be the main player. It might relate to the consumption of NADH in the conversion of glyceradehyde to glycerol and so reducing the need to decrease it using the glycerophosphate shuttle. Hard to be sure.
So. Uric acid is the evil molecular link between fructose and metabolic syndrome via NOX4. And yes, yes, you can block metabolic syndrome using allopurinol to reduce uric acid production in rats but you have to give them a sh*tload of it. After that NOX4 might be considered evil or hydrogen peroxide is evil or aconitase is evil when it's on strike. Lots of drug targets available for molecular cleansing.
My own concept is that there is the necessity to developing insulin resistance when fructose is available so as to limit glucose ingress to offset the ATP from that fructose ingress. If that is done by NOX4, so be it. The facility to deal with fructose by the generation of hydrogen peroxide is not random, it's not some accidental mistake perpetrated by evolution on hapless humans who munched on a few Crab apples or found a little honey. It is an appropriate evolutionarily response to a relatively common occurrence. The fact that uric acid mediated insulin resistance is common to alcohol metabolism as well as to fructose metabolism suggests that this mechanism is a general approach to dealing with a calorie input which takes priority over metabolising glucose.
Developing a drug along the lines of allopurinol to block uric acid production, or an inhibitor of NOX4, or a hydrogen peroxide scavenger to avoid insulin resistance is simply trying to block a perfectly adaptive response to a reasonable dose of fructose.
All that's needed to avoid a pathological response to fructose is to avoid ingesting a pathological dose of the stuff. There is actually quite a lot of evidence to suggest that physiological levels of uric acid production might be beneficial...
Peter
Fructose-driven glycolysis supports anoxia resistance in the naked mole-rat
which demonstrated that they (NMRs) appear to generate and use fructose as a coping stratagem for dealing with hypoxia or even anoxia. This is fascinating and leads back to research in the late 1980s, mostly looking at anoxia in liver or liver cells. I'm guessing that this liver work was funded to look at ways of improving the condition of transplant grafts. Fructose is significantly better than glucose for supporting anoxic liver cells, possibly something you might expect, possibly not. Perhaps in another post.
Anyway. So I've been looking at why fructose is different to glucose and to do this you end up asking rather difficult questions about the upper sections of both glycolysis and fructolysis.
Fructose enters the fructolytic pathway by being phosphorylated very rapidly to fructose-1-phosphate. Given a large enough supply of fructose this phosphorylation can deplete the ATP supply in a cell, most obviously in hepatocytes which bear the brunt of metabolising fructose. This takes place before aldolase generates the trioses which probably (or don't, in the case of fructose) control insulin signalling through mtG3Pdh and the glycerophosphate shuttle.
If this initial ATP depletion by fructokinase is profound it is perfectly possible to take two "waste" ADP molecules and transfer a phosphate from one to the other. This generates one ATP and one AMP. The ATP is useful to the cell and the excess AMP is degraded to uric acid.
This is all basic biochemistry.
In the Protons series I have worked on the (incorrect) basis that fructose should drive the glycerophosphate shuttle hard enough to generate RET (reverse electron transport) and so signal insulin resistance. The degree of insulin resistance should neatly reduce insulin mediated glucose supply by an appropriate amount to offset the fructose and so maintain a stable flux of ATP generation from the combined fructose and glucose. That's not quite how it appears to work. Even before the aldolase step in fructolysis, the body is starting to prepare the process of insulin resistance. This paper is not unique but shows general principles:
Uric acid induces hepatic steatosis by generation of mitochondrial oxidative stress: potential role in fructose-dependent and -independent fatty liver
The title of the paper is sneaky, it doesn't give away the answer! Nor does the abstract. If you don't want to read the paper, the missing link is NOX4.
NADPH oxidase 4 (NOX4), if exposed to uric acid (present here from fructolysis induced AMP degradation), translocates to the mitochondria and starts to generate enough hydrogen peroxide* to down regulate aconitase, abort the TCA and divert citrate out of the mitochondria through the citrate/malate shuttle for DNL. This will not just affect fructose metabolism, acetyl-CoA from glucose, entering the TCA as citrate, will also be diverted to DNL.
*The NOX family appear to be the only enzymes with no function other than to produce ROS, mostly superoxide. NOX4 is unique in that it always produces hydrogen peroxide. There is uncertainty if the "E loop" of the enzyme converts superoxide to hydrogen peroxide directly or if this is a docking site for superoxide dismutase, which does the conversion as an accessory module to NOX4.
I think it is a reasonable assumption that the hydrogen peroxide generated by NOX4 will be what signals the insulin resistance induced by fructose, rather than RET via mtG3Pdh. Quite why fructose doesn't drive the glycerophosphate shuttle is a difficult question to answer. Obviously the aldolase products of fructose-1-P (fructolysis) differ from those of fructose-1-6-bisphosphate (glycolysis) but these pathways are very difficult to get at experimentally and I've not found any papers looking at what controls why dihydroxyacetone phosphate from fructolysis doesn't drive mtG3Pdh, but that appears to be the case. There are hints that some activation of the glycerophosphate shuttle does occur but NOX4 seems to be the main player. It might relate to the consumption of NADH in the conversion of glyceradehyde to glycerol and so reducing the need to decrease it using the glycerophosphate shuttle. Hard to be sure.
So. Uric acid is the evil molecular link between fructose and metabolic syndrome via NOX4. And yes, yes, you can block metabolic syndrome using allopurinol to reduce uric acid production in rats but you have to give them a sh*tload of it. After that NOX4 might be considered evil or hydrogen peroxide is evil or aconitase is evil when it's on strike. Lots of drug targets available for molecular cleansing.
My own concept is that there is the necessity to developing insulin resistance when fructose is available so as to limit glucose ingress to offset the ATP from that fructose ingress. If that is done by NOX4, so be it. The facility to deal with fructose by the generation of hydrogen peroxide is not random, it's not some accidental mistake perpetrated by evolution on hapless humans who munched on a few Crab apples or found a little honey. It is an appropriate evolutionarily response to a relatively common occurrence. The fact that uric acid mediated insulin resistance is common to alcohol metabolism as well as to fructose metabolism suggests that this mechanism is a general approach to dealing with a calorie input which takes priority over metabolising glucose.
Developing a drug along the lines of allopurinol to block uric acid production, or an inhibitor of NOX4, or a hydrogen peroxide scavenger to avoid insulin resistance is simply trying to block a perfectly adaptive response to a reasonable dose of fructose.
All that's needed to avoid a pathological response to fructose is to avoid ingesting a pathological dose of the stuff. There is actually quite a lot of evidence to suggest that physiological levels of uric acid production might be beneficial...
Peter
Mulkidjanian: Na+ pump or Na+/H+ antiporter?
Mulkidjanian is a co-worker with Skulachev and extremely wedded to the primacy of Na+ bioenergetics, which is good. He has been looking at NuoH and NuoN subunits of complex I and their phylogenetics. In contrast to this, in the past I've discussed similarities between NuoH and NuoL. You just have to accept we're never going to be certain which component of complex I is most closely related to another... Anyway, I like this paper:
Phylogenomic Analysis of Type 1 NADH:Quinone Oxidoreductase
"Two recently published works independently noted the structural similarity between the NuoH and NuoN subunits and suggested their origin by some ancestral membrane protein duplication [13, 14]. Our analysis does not exclude the possibility that this duplication may have occurred even before the LUCA stage. In this case the initial NDH-1 form [proto-Ech in my terminology] had only one type of membrane subunit (the ancestor of NuoN and NuoH), which could function as a sodium transporter. The duplication of the gene would result in a different subunit, which improved the kinetic effectiveness of the redox-dependent sodium export pump (that participated in maintenance of [K+]/[Na+] greater than 1 in a primal cell) by facilitating proton translocation in the reverse direction".
Bear in mind that none of us can be certain exactly what a given protein might have been doing based on these family trees of genes.
I think there is general agreement that ancestor of NuoH and NuoN is a membrane pore and that it is primordial. In Mulkidjanian's scenario that pore is associated with a redox driven hydrogenase. His idea is that the hydrogenase is using preformed ferredoxin, or something similar, to extrude Na+ ions from the cell. This requires an external source of energy and his concept is for ZnS catalysed photosynthesis giving a localised organic "soup", ie heterotrophy. The refs are here and here. The source of K+ for the primordial cell cytoplasm is suggested here. I have to say, I'm not a convert to these aspects of his ideas, I'm staying more aligned with autotrophic thinking...
My own view is that the pore was a duct to localise oceanic acidic pH tightly to an NiFeS hydrogenase within alkaline vent "cytoplasm" to allow the hydrogenase to reduce ferredoxin, the primary energy currency of the proto-cell. The power source is the pH differential across an internal FeNiS moiety within the hydrogenase, combined with molecular hydrogen as the electron donor to reduce ferredoxin and so, eventually, CO2.
Given the almost certain ancestral gene duplication it is not difficult to make an antiporter out of NuoH/NuoN, whether you consider the ancestor to have been a proton pore or part of a Na+ pump. Even today, the membrane component of Complex I functions as an antiporter for Na+/H+ provided you separate it off from the hydrophilic matrix section:
The deactive form of respiratory complex I from mammalian mitochondria is a Na+/H+ antiporter
Given an antiporter sitting in a Na+ opaque membrane we can antiport a ton of Na+ out of the cell using a geological proton gradient to give us the result of a low intracellular Na+ concentration. Excess Na+ extrusion can be converted, by electrophoresis, to an elevated K+ inside giving the modern intracellular composition. In the early days the electrophoresis might not have been K+ specific, theoretically any positive ion other than Na+ would do. K+ is the long term preferred option.
As soon as we leave the vent there is no free antiporting so we need to have a system which provides energy to generate a Na+ potential (buffered by K+ electrophoresis). The power available to do this becomes very limited in the absence of a geothermal proton gradient, when all that is available is the reduction of CO2 using H2, the Wood–Ljungdahl pathway. The Na+ chemiosmotic circuit then comes in to it's own as a system for combining small amounts of free energy in to units large enough to generate one ATP molecule. Recall how the modern pyrophosphatase Na+ pump requires the hydrolysis of four PPi to give one ATP via chemiosmotic addition. Until the advent of photosynthesis and the possibility of heterotrophy, all free living prokaryotes would have been autotrophic and living on a meagre energy budget.
The switch from luxurious hydrothermal vent conditions to lean autotrophic conditions goes a long way to explaining the universality of chemiosmosis. Alkaline hydrothermal vents may be stable on geological time scales but not for 4 billion years of un-interrupted flow and if the Wood–Ljungdahl pathway is all there is to replace the vent power supply it's going to be chemiosmosis all the way...
Peter
Phylogenomic Analysis of Type 1 NADH:Quinone Oxidoreductase
"Two recently published works independently noted the structural similarity between the NuoH and NuoN subunits and suggested their origin by some ancestral membrane protein duplication [13, 14]. Our analysis does not exclude the possibility that this duplication may have occurred even before the LUCA stage. In this case the initial NDH-1 form [proto-Ech in my terminology] had only one type of membrane subunit (the ancestor of NuoN and NuoH), which could function as a sodium transporter. The duplication of the gene would result in a different subunit, which improved the kinetic effectiveness of the redox-dependent sodium export pump (that participated in maintenance of [K+]/[Na+] greater than 1 in a primal cell) by facilitating proton translocation in the reverse direction".
Bear in mind that none of us can be certain exactly what a given protein might have been doing based on these family trees of genes.
I think there is general agreement that ancestor of NuoH and NuoN is a membrane pore and that it is primordial. In Mulkidjanian's scenario that pore is associated with a redox driven hydrogenase. His idea is that the hydrogenase is using preformed ferredoxin, or something similar, to extrude Na+ ions from the cell. This requires an external source of energy and his concept is for ZnS catalysed photosynthesis giving a localised organic "soup", ie heterotrophy. The refs are here and here. The source of K+ for the primordial cell cytoplasm is suggested here. I have to say, I'm not a convert to these aspects of his ideas, I'm staying more aligned with autotrophic thinking...
My own view is that the pore was a duct to localise oceanic acidic pH tightly to an NiFeS hydrogenase within alkaline vent "cytoplasm" to allow the hydrogenase to reduce ferredoxin, the primary energy currency of the proto-cell. The power source is the pH differential across an internal FeNiS moiety within the hydrogenase, combined with molecular hydrogen as the electron donor to reduce ferredoxin and so, eventually, CO2.
Given the almost certain ancestral gene duplication it is not difficult to make an antiporter out of NuoH/NuoN, whether you consider the ancestor to have been a proton pore or part of a Na+ pump. Even today, the membrane component of Complex I functions as an antiporter for Na+/H+ provided you separate it off from the hydrophilic matrix section:
The deactive form of respiratory complex I from mammalian mitochondria is a Na+/H+ antiporter
Given an antiporter sitting in a Na+ opaque membrane we can antiport a ton of Na+ out of the cell using a geological proton gradient to give us the result of a low intracellular Na+ concentration. Excess Na+ extrusion can be converted, by electrophoresis, to an elevated K+ inside giving the modern intracellular composition. In the early days the electrophoresis might not have been K+ specific, theoretically any positive ion other than Na+ would do. K+ is the long term preferred option.
As soon as we leave the vent there is no free antiporting so we need to have a system which provides energy to generate a Na+ potential (buffered by K+ electrophoresis). The power available to do this becomes very limited in the absence of a geothermal proton gradient, when all that is available is the reduction of CO2 using H2, the Wood–Ljungdahl pathway. The Na+ chemiosmotic circuit then comes in to it's own as a system for combining small amounts of free energy in to units large enough to generate one ATP molecule. Recall how the modern pyrophosphatase Na+ pump requires the hydrolysis of four PPi to give one ATP via chemiosmotic addition. Until the advent of photosynthesis and the possibility of heterotrophy, all free living prokaryotes would have been autotrophic and living on a meagre energy budget.
The switch from luxurious hydrothermal vent conditions to lean autotrophic conditions goes a long way to explaining the universality of chemiosmosis. Alkaline hydrothermal vents may be stable on geological time scales but not for 4 billion years of un-interrupted flow and if the Wood–Ljungdahl pathway is all there is to replace the vent power supply it's going to be chemiosmosis all the way...
Peter
Thursday, April 20, 2017
Skulachev addendum
This is the final paragraph in the discussion section of the paper by Skulachev, regarding the use of a Na+/K+ concentration gradient across a membrane to store potential energy, convertible to a Na+ or H+ gradient as needed, and why elevated K+ does not have to be a primordial feature of proto-cells:
"One might think that Na+ ions are incompatible with life and this is the reason why K+ is substituted for Na+ in the cell interior. Apparently, it is not the case as, e.g., in halophilic bacteria [Na+]int can reach 2 M [41]. The very fact that some enzyme systems work better in the presence of K+ than of Na+, may be considered as a secondary adaptation of enzymes to the K+-rich and Na+-poor conditions in the cytosol [40]. Besides, it would have been dangerous to couple any work performance with Na+ influx to the cytoplasm if Na+ were a cell poison".
That makes perfect sense to me.
Peter
"One might think that Na+ ions are incompatible with life and this is the reason why K+ is substituted for Na+ in the cell interior. Apparently, it is not the case as, e.g., in halophilic bacteria [Na+]int can reach 2 M [41]. The very fact that some enzyme systems work better in the presence of K+ than of Na+, may be considered as a secondary adaptation of enzymes to the K+-rich and Na+-poor conditions in the cytosol [40]. Besides, it would have been dangerous to couple any work performance with Na+ influx to the cytoplasm if Na+ were a cell poison".
That makes perfect sense to me.
Peter
Wednesday, April 19, 2017
From Skulachev to LUCA
TLDR: Cells become islands of raised K+ ion concentration when energy is supplied.
Okay, here come the doodles based on Skulachev's paper
Membrane-linked energy buffering as the biological function of Na+/K+ gradient
This is the scenario in ultra modern bacteria, the pinnacle of about 4 billion years of evolution. The membrane is tight to all significant ions at reasonable temperatures and concentration gradients. In this set of pictures the proton population represented within the red circle is holding a membrane voltage of 180mV, as per usual:

The trans-membrane potential from the pumped protons is stable while ever the pumping and the consumption of protons is balanced. The problem is that it doesn't need many protons to generate that 180mV. Pumping any more than basic needs generates too great a membrane voltage. The converse is that it doesn't take much excess proton consumption to collapse the potential. So you need a buffer which does not waste the energy used to pump.
If a bacterium suddenly increases proton pumping by eating some glucose we have this problem of a spike in membrane voltage:

We can get around this by allowing a positive ion to travel in the opposite direction. This will stop the rising membrane potential as the ion uses the membrane potential to enter the cell against a concentration gradient. It uses an ion-specific channel, in this case for potassium. This process is electrophoresis down the electrical gradient, against a concentration gradient, powered by the electrical component rather than the pH component of the rising proton gradient:

The number of K+ ions matches the excess protons pumped. The electrical potential is thus maintained at 180mV at the "cost" or "benefit" (semantics here!) of K+ entering the cell. But there is a problem in that the more protons pumped and the more K+ entering the cell, the higher the pH of the intracellular medium becomes. That K+ pool is actually tied to the OH- left behind by pumping out H+. Caustic potash...

This is not good for metabolic processes. But it is easily surmounted using a 1:1 ratio Na+/H+ (electro-neutral) antiporter to get some protons back in to the cell to offset the excess OH-

while still maintaining an electrical gradient of 180mV using H+, keeping an electro-neutral Na+/K+ gradient as an energy store:

Obviously the Na+/H+ antiporter is being driven by the pH component of the proton gradient. It's neat how evolution has separated out the pH and electrical components of a proton gradient!
The whole system is fully reversible so if there is a sudden drop in proton pumping the transmembrane Na+/K+ gradient can be reconverted to a proton gradient to "buffer" changes in proton translocation. This seems to be how modern, proton pumping bacteria with superbly proton tight membranes work. In E coli the ion channel and antiporter are ATP gated.
That's how Skulachev looked at modern bacteria in 1978.
I'm now going to wander off on my own and speculate about LUCA with a proton leaky but Na+/K+ tight membrane. This is just me from here onwards:
Let's have a think about LUCA, with a cell membrane which is tight to Na+, and probably K+ too, but highly leaky to both protons and hydroxyl ions. Metabolism is based on Na+ pumping and a Na+ specific ATP synthase. The initial Na+/H+ antiporter (from the Life series) is gone as a source of Na+ gradient as soon as LUCA leaves the alkaline hydrothermal vents.
I like the idea that LUCA used a pyrophosphatase to pump Na+ but with any Na+ pump we have the same problem as in modern bacteria: You can only store a small amount of energy as a 180mV Na+ gradient, as per H+ above:

But excess Na+ pumping can be easily be accommodated by K+ electrophoresis:

There is no need for the Na+/H+ antiporter in this scenario because there is no pH change associated with pumping Na+ ions, so all we need is the ion specific channel for K+.
This sets up a non-electrical energy store which is "accessible" to form an electrical gradient when primary Na+ pumping is low.
The buffer automatically implies the generation of a raised intracellular K+. We have here, based on a tiny step beyond Skulachev's ideas, a place within LUCA which is potassium rich. It's simply produced to buffer changes in ion pumping by the primary Na+ pump (or usage by ATP synthase) across relatively primitive membranes. And driving intracellular K+ higher is an indicator to the cell that there is excess of energy available, which should select for increased enzyme activity based on rising intracellular K+ concentration. Many of the "core" LUCA enzymes do indeed use K+ as a cofactor to function optimally.
Summary: Cells become islands of raised K+ ion concentration when more than basal a level of energy is supplied. Remember that for our later discussion about Mulkidjanian's ideas on the origin of life on Earth.
Peter
Okay, here come the doodles based on Skulachev's paper
Membrane-linked energy buffering as the biological function of Na+/K+ gradient
This is the scenario in ultra modern bacteria, the pinnacle of about 4 billion years of evolution. The membrane is tight to all significant ions at reasonable temperatures and concentration gradients. In this set of pictures the proton population represented within the red circle is holding a membrane voltage of 180mV, as per usual:

The trans-membrane potential from the pumped protons is stable while ever the pumping and the consumption of protons is balanced. The problem is that it doesn't need many protons to generate that 180mV. Pumping any more than basic needs generates too great a membrane voltage. The converse is that it doesn't take much excess proton consumption to collapse the potential. So you need a buffer which does not waste the energy used to pump.
If a bacterium suddenly increases proton pumping by eating some glucose we have this problem of a spike in membrane voltage:

We can get around this by allowing a positive ion to travel in the opposite direction. This will stop the rising membrane potential as the ion uses the membrane potential to enter the cell against a concentration gradient. It uses an ion-specific channel, in this case for potassium. This process is electrophoresis down the electrical gradient, against a concentration gradient, powered by the electrical component rather than the pH component of the rising proton gradient:

The number of K+ ions matches the excess protons pumped. The electrical potential is thus maintained at 180mV at the "cost" or "benefit" (semantics here!) of K+ entering the cell. But there is a problem in that the more protons pumped and the more K+ entering the cell, the higher the pH of the intracellular medium becomes. That K+ pool is actually tied to the OH- left behind by pumping out H+. Caustic potash...

This is not good for metabolic processes. But it is easily surmounted using a 1:1 ratio Na+/H+ (electro-neutral) antiporter to get some protons back in to the cell to offset the excess OH-
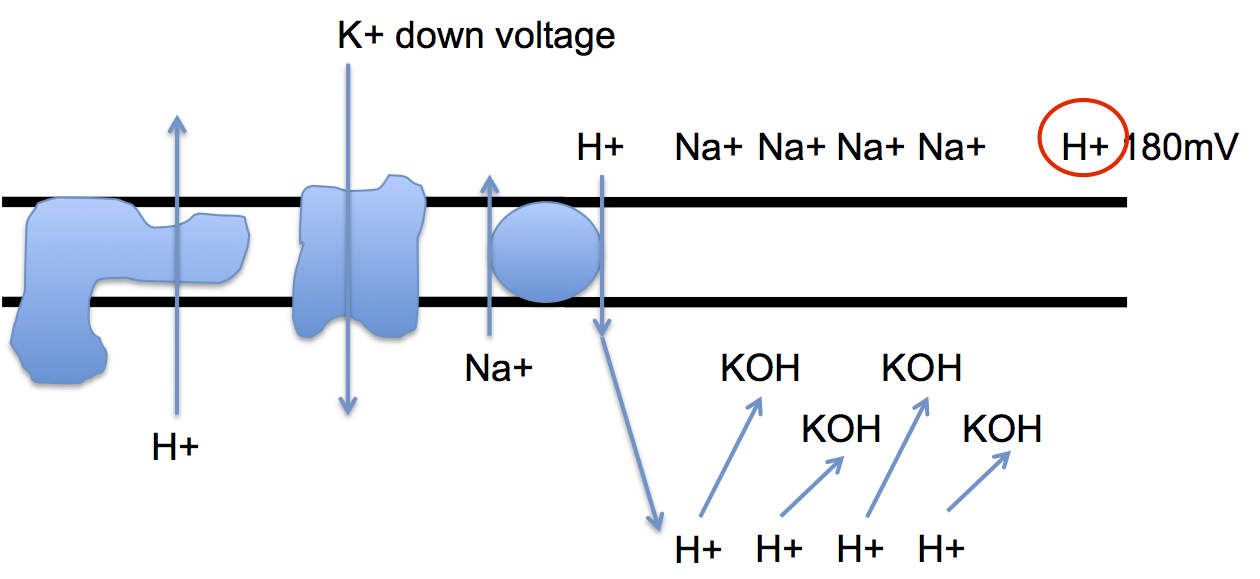
while still maintaining an electrical gradient of 180mV using H+, keeping an electro-neutral Na+/K+ gradient as an energy store:

Obviously the Na+/H+ antiporter is being driven by the pH component of the proton gradient. It's neat how evolution has separated out the pH and electrical components of a proton gradient!
The whole system is fully reversible so if there is a sudden drop in proton pumping the transmembrane Na+/K+ gradient can be reconverted to a proton gradient to "buffer" changes in proton translocation. This seems to be how modern, proton pumping bacteria with superbly proton tight membranes work. In E coli the ion channel and antiporter are ATP gated.
That's how Skulachev looked at modern bacteria in 1978.
I'm now going to wander off on my own and speculate about LUCA with a proton leaky but Na+/K+ tight membrane. This is just me from here onwards:
Let's have a think about LUCA, with a cell membrane which is tight to Na+, and probably K+ too, but highly leaky to both protons and hydroxyl ions. Metabolism is based on Na+ pumping and a Na+ specific ATP synthase. The initial Na+/H+ antiporter (from the Life series) is gone as a source of Na+ gradient as soon as LUCA leaves the alkaline hydrothermal vents.
I like the idea that LUCA used a pyrophosphatase to pump Na+ but with any Na+ pump we have the same problem as in modern bacteria: You can only store a small amount of energy as a 180mV Na+ gradient, as per H+ above:

But excess Na+ pumping can be easily be accommodated by K+ electrophoresis:

There is no need for the Na+/H+ antiporter in this scenario because there is no pH change associated with pumping Na+ ions, so all we need is the ion specific channel for K+.
This sets up a non-electrical energy store which is "accessible" to form an electrical gradient when primary Na+ pumping is low.
The buffer automatically implies the generation of a raised intracellular K+. We have here, based on a tiny step beyond Skulachev's ideas, a place within LUCA which is potassium rich. It's simply produced to buffer changes in ion pumping by the primary Na+ pump (or usage by ATP synthase) across relatively primitive membranes. And driving intracellular K+ higher is an indicator to the cell that there is excess of energy available, which should select for increased enzyme activity based on rising intracellular K+ concentration. Many of the "core" LUCA enzymes do indeed use K+ as a cofactor to function optimally.
Summary: Cells become islands of raised K+ ion concentration when more than basal a level of energy is supplied. Remember that for our later discussion about Mulkidjanian's ideas on the origin of life on Earth.
Peter
Monday, April 17, 2017
Skulachev in 1978
We know from papers like
Effect of Very Small Concentrations of Insulin on Forearm Metabolism. Persistence of Its Action on Potassium and Free Fatty Acids without Its Effect on Glucose
that, as we raise the concentration of insulin perfusing a tissue bed, the first effect is the suppression of lipolysis. Then it promotes potassium translocation in to cells. If you keep the concentration low enough there is zero effect on glucose translocation.
More practically: Anyone in first line general practice will be well familiar with the moribund cat with an obstructed bladder (thank you Go Cat) and a plasma K+ of 11.0mmol/l. You know the intravenous dose of Ca2+ you've given will stave off a-systole for a while and you've started to correct the acidosis with bicarbonate but the ECG still looks awful, as does the rest of the cat. Neutral insulin, covered by glucose, will usually drive potassium back in the cells where it belongs and keep the patient alive for long enough to allow you to get to work on the underlying problem. Pure potassium pragmatism.
So I have always wondered: Why does insulin facilitate active K+ translocation in to cells?
This strikes me as a very deep question. Always has.
There are hints as to why in Skulachev's paper from 1978.
Membrane-linked energy buffering as the biological function of Na+/K+ gradient.
I've only just found this paper and skimmed through it so far. It's a really interesting piece of theoretical bioenergetics from a close friend of the late Peter Mitchell. It was published in the year that Mitchell received his Nobel Prize for elucidating the principles of chemiosmosis. The paper is one of those which needs a note pad, a pencil and a pencil sharpener to work through. On the to-do list but I think it is saying that K+/Na+ translocation is an energy buffer to smooth out rapid changes in proton translocation energetics. That is a deep process.
I hope that's what Skulachev is saying!
And the follow on: Insulin signals a flood of calories. You're going to either spike delta psi or need to buffer it. That needs K+ to enter the cytoplasm to limit the voltage spike induced by the subsequent increase in H+ exit via pumping... Is insulin pre-empting this need? I'll try and get some doodles together but off-blog is getting busy at the moment.
Skulachev is still publishing important stuff today and his department is deeply involved in the evolutionary primacy of Na+ bioenergetics and, as a recent foray in to clinical pragmatism, the development of mitochondrial targeted antioxidants which appear to extend healthspan as well as lifespan.
Interesting chap and the 1978 paper strikes me as very perceptive and very prescient. You don't get many that good.
Peter
Effect of Very Small Concentrations of Insulin on Forearm Metabolism. Persistence of Its Action on Potassium and Free Fatty Acids without Its Effect on Glucose
that, as we raise the concentration of insulin perfusing a tissue bed, the first effect is the suppression of lipolysis. Then it promotes potassium translocation in to cells. If you keep the concentration low enough there is zero effect on glucose translocation.
More practically: Anyone in first line general practice will be well familiar with the moribund cat with an obstructed bladder (thank you Go Cat) and a plasma K+ of 11.0mmol/l. You know the intravenous dose of Ca2+ you've given will stave off a-systole for a while and you've started to correct the acidosis with bicarbonate but the ECG still looks awful, as does the rest of the cat. Neutral insulin, covered by glucose, will usually drive potassium back in the cells where it belongs and keep the patient alive for long enough to allow you to get to work on the underlying problem. Pure potassium pragmatism.
So I have always wondered: Why does insulin facilitate active K+ translocation in to cells?
This strikes me as a very deep question. Always has.
There are hints as to why in Skulachev's paper from 1978.
Membrane-linked energy buffering as the biological function of Na+/K+ gradient.
I've only just found this paper and skimmed through it so far. It's a really interesting piece of theoretical bioenergetics from a close friend of the late Peter Mitchell. It was published in the year that Mitchell received his Nobel Prize for elucidating the principles of chemiosmosis. The paper is one of those which needs a note pad, a pencil and a pencil sharpener to work through. On the to-do list but I think it is saying that K+/Na+ translocation is an energy buffer to smooth out rapid changes in proton translocation energetics. That is a deep process.
I hope that's what Skulachev is saying!
And the follow on: Insulin signals a flood of calories. You're going to either spike delta psi or need to buffer it. That needs K+ to enter the cytoplasm to limit the voltage spike induced by the subsequent increase in H+ exit via pumping... Is insulin pre-empting this need? I'll try and get some doodles together but off-blog is getting busy at the moment.
Skulachev is still publishing important stuff today and his department is deeply involved in the evolutionary primacy of Na+ bioenergetics and, as a recent foray in to clinical pragmatism, the development of mitochondrial targeted antioxidants which appear to extend healthspan as well as lifespan.
Interesting chap and the 1978 paper strikes me as very perceptive and very prescient. You don't get many that good.
Peter
Subscribe to:
Posts (Atom)