Monday, May 31, 2021

Random musings on uncoupling (3) oxygen consumption

This is an nice little study from Japan looking at the effect of fat composition of diet on oxygen consumption before and after a meal:

Diet-Induced Thermogenesis Is Lower in Rats Fed a Lard Diet Than in Those Fed a High Oleic Acid Safflower Oil Diet, a Safflower Oil Diet or a Linseed Oil Diet

We can accept changes in oxygen consumption as a pretty good surrogate for the degree of uncoupling.

These are the diets used


The sucrose content is around 5% of calories so no confounder there. Fat is consistently 40% of calories and they measured the composition of the fats used. Like this


This lard is Japanese lard, produced in the early years of the 1990s. It's 7% linoleic acid. With lipids at 40 % of the calories in the diet this means that overall the LA provides 2.8% of the calories. So this is not an obesogenic diet*. However we get very little information about that because the rats were grown under a time restricted, calorie restricted protocol. An energy intake value was chosen as about the amount of food that a hungry rat would eat in an hour. This amount was fed twice a day. So there is no browsing allowed which suggests that some modest degree of caloric restriction is in place and the absolute supply of calories will be the same for all groups, despite each group have differing overall metabolic needs.

*[If the old anecdote about pork consumption in Okinawa is true this lipid profile might explain any possible longevity effect.]

The high oleic safflower oil diet provides 6% of calories as LA, the safflower oil diet provides 30% of calories as LA and the linseed oil diet provides 6% LA but this is combined with 21% as ALA. Alpha linolenic acid, from the ROS/Protons perspective, is an extreme version of LA although hard evidence for this is very thin on the ground. There are many studies using ALA which show that it is marvellous stuff at any dose rate but these studies almost always use "pair fed" or fixed calorie, mildly restricted protocols.

The protocol here also describes confirming that none of the diets generated lipid peroxides before being fed to the rats. The group is quite meticulous, so refreshing.

Here are the oxygen consumptions, indicating the degree of uncoupling present in the immediate post-meal period:


We can see that lard at 2.8 % of calories as LA shows very little uncoupling. Diets with LA between 6% and 30% LA uncouple more, although there is no evidence of a graduated response, and that a mix of 6%LA with 21% ALA uncouples the most, although this latter is only statistically ns greater than for the other PUFA groups, with a group size of six rats.

So. Given a fixed, mildly restricted calorie intake, we can take the lard fed rats as being very close to metabolically "normal", and eating closest to what they might want if fed ad-lib. Then we have three groups of rats, fed exactly the same number of calories, whose diet has been modified to induced a significant amount of uncoupling. All animals are at the same room temperature so obligatory thermogenic needs should be equal. So higher PUFA groups of animals will waste some of their consumed energy and not be allowed to replace it. What happens to body weights?


The low PUFA lard fed rats are the heaviest and carry about 5% more carcass fat than the PUFA fed rats. I consider them to be at normal body weight. Visceral fat, a surrogate for metabolic damage, is identical across the groups, all are free from clinical metabolic syndrome.

I would argue that the heavier rats are the least hungry, the high oleic acid safflower fed rats are a little more hungry and the two high PUFA diet rats are the most hungry. Quite what would have happened if the study had included an ad-lib fed arm we will never know.

So here's some speculation about "what if" there had been an ad-lib arm to the study:

The lard fed rats (this time) are our normal group and would weigh only a little more due to relief from calorie restriction. It would be nice if the ad-lib fed 6% LA group might have ended up with modest excess energy storage as fat gain and shown extra food consumption to match the extra weight gain. The high ALA fed group should have consumed even more food with less or similar weight gain because uncoupling is having a significant effect. Finally the group with 30% calories as LA should have come out somewhere between. The group having 30% of LA calories seems to be just on the border between where the ROS calorie storage effect transitions to the uncoupling effect in terms of dominance. From other studies 45% of calories as LA might have had the uncoupling effect absolutely dominating, so a slim phenotype would show, but that would be impossible in a diet where only 40% of calories are from fat in total.

How does this fit in to cellular "hunger" concept? At levels of linoleic acid where facilitated diversion of calories to storage predominates, excessive insulin signalling is dominant. The cell is dealing with an hypercaloric state.

Under marked uncoupling conditions the cellular state is the opposite. A separate defence mechanism against caloric excess is being activated, whether there is a caloric excess or not, by dropping the mitochondrial membrane potential because the closer a diet gets to 45% LA diet the more it provides a supra-physiological level of LA for the uncoupling protein function to maximise, combined with copious supplies of oxidative products such as 4-HNE to activate those uncoupling proteins.

At this point ROS generation is suppressed because, whatever the FADH2:NADH ratio, high mitochondrial membrane potential is still essential for reverse electron transport. There will be a transition from failure to limit ROS generation (forcing a cellular energy surfeit) to a reduction in insulin signalling as the result of a process which also involves the direct loss of calories by uncoupling (an hypocaloric state). The fact that suppressed insulin signalling releases fatty acids is over ridden by their loss through overactive uncoupling.

So PUFA are able to produce both cellular repletion and cellular hunger depending on the concentration.

It feels counterintuitive that a metabolite should, by one action, generate an hypercaloric state with excess energy storage and yet, by a separate process, go on to produce the opposite effect via uncoupling at higher levels of exposure.

But this appears to be the case.

It becomes much clearer using pharmacological uncoupling, which takes us back to 2,4-dinotrophenol.

Peter

Saturday, May 29, 2021

Random musings on uncoupling (2) revised

Okay, here is how I ended the last post:

"It's also worth pointing out that this appears to be an ancient system and that high PUFA exposure might uncouple in anticipation of the cellular caloric influx which PUFA signify. It has become pre emptive and has, certainly in rodents, largely been shifted from "all" cells primarily to the brown adipose tissue. The PUFA signal might also be very central to the browning of white adipose tissue to beige. That's a process you would never want to have to use, being in a situation where generating beige adipose tissue might be helpful is not somewhere you want to go."

which is wooly thinking, to say the least.

Uncoupling is triggered by ROS generation using a locally available PUFA derived lipoxide signal combined with whatever fatty acids are available in the immediate vicinity of the mitochonrial inner membrane uncoupling proteins. A supply of PUFA is absolutely needed for the signalling molecule generation (4-HNE and related) and intact PUFA have been selected to uncouple better than saturated fats do. These features might be related.

PUFA are always present in the inner mitochondrial and have many functions. this function of acting as a safety valve appears to be one of them. It will not need to be specifically linked to bulk PUFA induced cellular caloric excess. I envisage it as a response to any excess caloric ingress, hyperglycaemia or markedly elevated FFAs post prandially (or even elevated levels of systemic fructose) when the law of mass action (ie a large concentration gradient) overwhelms the normal response of insulin resistance when cells are replete.

I view this aspect as the ancient system. It applies to any caloric overload and happens to use a PUFA/ROS signal to limit excessive mitochondrial membrane potential using uncoupling.

The fact that this system is functional at levels of PUFA intake far in excess of those that a particular species (humans) might be adapted to is perhaps unexpected but does seem to be the case, but this is more understandable if it is viewed as a generic safety mechanism.

Whether those slim rodent models consuming 45% of their calories as linoleic acid are dealing with excess caloric ingress by uncoupling or whether they are actually under caloric deficit because the emergency uncoupling system is being activated inappropriately due to oversupply of signalling precursors/uncoupling facilitating fatty acids is not clear.

Peter

Thursday, May 27, 2021

Seasonality

I see winter has arrived in Melbourne. 😞

Peter

Random musings on uncoupling (1)

I thought I'd just take a break from trying to find any studies where sucrose-in-chow causes obesity in the absence of greater than 8% of calories as linoleic acid. That's becoming rather frustrating but is turning up some interesting studies on uncoupling and PUFA along the way.

So just for this post I thought I'd get even more speculative than normal about uncoupling.

Thermogenesis. Thermogenesis makes you hungry. That is not a completely intuitive statement.

It's easiest if we start with a food source which generates heat without utilising uncoupling because there are far less variables to think about. So think protein. Deconstructing a protein chain, processing amino acids to their core constituent energetic compounds such as pyruvate, glutamate etc requires energy and this energy shows up as heat.

Let's say 1000kcal of protein generates 300kcal of heat. I've no idea of (or interest in) the exact value, I just know you can warm a hypothermic patient post operatively using an IV amino acid infusion.

So if you are used to eating 2000kcal of fat a day to run your metabolism, you metabolism requires 2000kcal, tightly controlled. Let's also imagine you live in a thermoneutral environment and so are not muddying the water with (usually necessary) thermogenesis to maintain your body temperature.

If you swap your 2000kcal of fat for 1000kcal of fat plus 1000kcal of protein things change. The 1000kcal of protein provides 700kcal of usable energy and 300kcal of waste heat, which you don't need as you are in a thermoneutral environment.

So you get hot and uncomfortable and have a 300kcal deficit. You cannot run your metabolism of 1700kcal, you need 2000kcal. The hypothalamus notices this 300kcal deficit. What would you do? You would feel hungry and eat enough extra food to ensure that you actually get the 2000kcal you need for metabolism, tolerating the excess heat generation as an unwanted side effect. You would stay weight stable, eat a little extra to hunger and be sweaty.

Forced overfeeding is equally straightforward. You eat too much, uncouple, lose heat and hope you don't really live in a theroneutral environment.

Next is what happens under spontaneous eating but including more than 8% of calories as linoleic acid in your diet.

Here my hypothesis is that excess calories are available, the cell fills up and poorly-opposed insulin allows more calories to enter and for those calories to be sequestered out of the way as lipid (and probably glycogen too). From the cellular point of view energy status is fine (not overloaded) so long as the excess calories entering are being sequestered away from metabolism. The hypothalamus might perceive too few calories in the arterial blood in direct proportion to those being lost into storage in the periphery. So you eat more.

The next step in thinking is 2,4-dinotrophenol. This is a classical uncoupler and probably the most effective weight loss drug, particularly for fat loss, ever marketed. Sadly the therapeutic margin is narrow, unpredictable and can change suddenly.

High dose rate, rapid weigh loss DNP administration uncouples respiration to the point of ATP reduction and massive heat generation. AMPK is activated by the consequences of the fall in ATP, ensuring effective fat oxidation. With a marked fall in mitochondrial membrane potential there is going to be a cessation of reverse electron transport and the mitochondrial component of the ROS generation essential to maintain insulin signalling will collapse. At this point calories will be entering the cell through AMPK facilitated GLUT4s (and probably CD36s as well) and will not be diverted to storage but used for a combination of running metabolism plus extra calories equal to those lost as heat.

I understand from reading around a little that DNP does, indeed, make you hungry. The calories pouring though the mitochondria are coming from fat primarily and if the fat supply cannot keep up with the uncoupling-augmented metabolic needs then blood energy content will fall and the hypothalamus will notice. Also interesting is the use of drugs such as caffeine and ephedrine to control that hunger, both of which are reputed to work. They increase basal and sympathomimetic induced lipolysis, supply more fat and so control the hunger. So the loss of fat from adipocytes due to failed insulin signalling cannot quite keep up with the increased metabolic heat production without a little help. Not surprising because the shrinkage of adipocytes is from a failure of insulin signalling to facilitate fatty acid uptake combined with unopposed basal/sympathetic lipolysis. Neither is directly related to the huge loss of calories from unrestrained uncoupling. It surprises me a little that the supply and demand are so closely matched in such a complex system, especially with a major spanner dropped in to the works.

Which just leaves us with PUFA. These appear to facilitate uncoupling in proportion to the amount present in the diet, even on a meal by meal basis. My mental image for this phenomenon is that, intrinsically, PUFA allow too many calories in to a cell if insulin is the facilitating hormone. The more pronounced this effect, the more the need for uncoupling.

Modest excess, say over 8% of the diet by calories, works by the standard ROS/Protons concept of sequestration of excess calories. But you can only sequester so many excess calories and very high percentages of PUFA have the potential to overwhelm the system. We are talking 35% or over for uncoupling to predominate, but I think this might be a linear effect which is over-shaddowed by the ROS effect at lower concentrations but comes to dominate at very high concentrations.

At these very high levels of uncoupling the body is in caloric deficit because it is actually losing the calories as heat. It is metabolically the equivalent of the hunger of a high fat (10-30% PUFA) diet but does not involve the distention of adipocytes to achieve it. The degree of hunger would be in proportion to the deficit between lipolysis and heat loss via uncoupling and would require (not allow) a few extra calories to be eaten.

EDIT: This last section is poor logic. It might be worth a post to clarify or just a an edit to correct. I'm thinking about it.  I'll take it out and put a more considered discussion up as a follow on post. END EDIT.

Peter

Tuesday, May 25, 2021

Of mice and men (3) Sucrose

There is a lot of variability in the linoleic acid content of lard. Good studies get round this by measuring LA using gas chromatography. From this paper we have Chinese lard containing 10% LA and from this paper we have Brazilian lard containing 17% LA. I've seen values cited as high as 30% but they have never been quite as convincing as the results table in a publication, though I see no reason to doubt them per se.

From the Protons/ROS perspective even 8% of total calories as linoleic acid is usually enough to get to be obesogenic, particularly if a little extra soybean oil is added as an "essential fatty acid source" (no sniggering at the back), which nicely explains most obesity paradoxes.

I have been revisiting various high and low fat diets in the aftermath of the Speakman paper which was so confusing as regards D12451 and its specifically marketed control diet D12451B.

Here are the compositions of both because Research Diets no longer lists D12451B as a standard diet:


So we have D12451B, a slimming diet, used as the control diet in the paper discussed in the last post. That will relate to the LA content which I calculate out at 3.2% of calories. The obesogenic D12451 comes out at 6.7% of calories as LA if we used Chinese lard, 9.5% using Brazilian lard and goodness knows how much using lard from the USA or UK.

The sucrose values are fascinating. D12451B provides 35% of calories as sucrose plus 35% as starch/maltodextrin and is slimming. D12451 provides 17% of calories as sucrose and is obesogenic. So this long established, slightly old fashioned pair of diets speak strongly against sucrose being the driver of obesity, they are more compatible with it being linoleic acid.

However I find the sucrose cannot be ignored. You can design your study to show sucrose as good, bad or mystifying. Let's think about sucrose.

I used to really rather like this group, which I've mentioned before :


In this first paper they either fed mice on CE-2 standard Japanese laboratory rodent chow. It's specified at around 6% LA acid of total calories so is borderline high, has no sucrose and is clearly functional as a lab chow. They had two intervention groups, for one they diluted CE-2 down with starch and for the other they diluted CE-2 down with sucrose. As they say:

"the latter two diets were prepared by the addition of corn starch or sucrose, respectively, to CE‐2 (Table 1)."

Here is how the diets turned out:


This simple action diluted the protein, fat and vitamin/mineral content as was clearly documented. I don't really buy in to the protein leverage hypothesis so I'm not surprised that all groups ended up at exactly the same bodyweight despite reducing protein calories for two of the groups.

What I do tend to take note of is the fat dilution. The fat is all of the same composition, around half of the 12% total fat calories is LA, giving 6% for CE-2. Diluting its 12% of total fat calories to 7.7% reduces LA from 6% of total calories to 3.7% of total calories for either intervention. Neither the high starch nor high sucrose diet produced any excess weight gain, much as you would expect for a either diet with LA at 3.7% of calories.

Now, their second paper is MUCH more interesting. Here it is:


and here are the diets:


There is no suggestion of grinding up CE-2 with extra starch or sucrose this time. These are custom diets of unspecified origin/composition (so I'm going off these people now). I'm going to assume NC (normal chow) is still CE-2 and that the 12% fat in each diet is still soybean oil.

The protein is reduced for both intervention diets (just as it was diluted in the previous study), carbohydrate sources and quantities are kept unchanged.

But the fat is NOT reduced/diluted. If we assume that the now maintained 12% of calories is still mostly soybean oil we are now at 6% of calories as LA in the intervention groups, up from 3.7% in the previous experiments. Back to borderline obesogenic. 

This time their very high starch diet is grossly obesogenic, their chow (lower starch, possibly less refined) is not and the high sucrose diet is positively slimming. And these sucrose fed mice are definitely not "skinny-fat", see the rest of the paper re insulin sensitivity. Okay, here's the insulin tolerance test, it's from the first paper, the ITT in the second paper is similar but doesn't drop quite as low because there is a little more fat in the diet. I'm impressed by the drop to 20% so I like this particular image!


You can't use an OGTT or IPGTT as a high sucrose diet down regulates hepatic glucokinase so a glucose tolerance test would (and does) generate systemic hyperglycaemic for a short period. And here are the weights:


All of the mice this time are on 6% LA (assuming I'm correct re composition). The grey circles are mice on a very high starch diet, they get fat. The open circles are on chow. We could describe them as also being on a 6% LA diet with modest carbohydrate restriction cf the high starch fed mice on the same LA percentage. They don't get particularly fat. In the presence of 6% LA even modest carbohydrate reduction appears to be slimming.

Then we have the diet with 38.5% of calories from sucrose as the black circles. These mice are slim, absolutely not insulin resistant and they happen to have hot brown adipose tissue secondary to uncoupled mitochondria through generation of FGF-21 secondary to fructose ingestion.

I do not have the mechanism for this. It will undoubtedly be driven by ROS generation and this will more likely be driven by NOX enzymes than mitochondrial reverse electron transport. I am also suspicious that modest sucrose ingestion might drive obesity as in the Surwit diets and D12451 but that a very high sucrose diet might uncouple respiration and prevent obesity and metabolic syndrome. Why?

Consider the parallels with PUFA diets with between around 8% and 30% of calories from LA. These fail to limit insulin signalling and allow excess calories in to a cell. At these modest levels of LA the inappropriate excess caloric ingress can be stored by the inappropriate transfer in to triglycerides. Both ingress and storage are both allowed and achieved by un-resisted insulin signalling.

At very high levels of LA, moving from over 30% of calories from LA to over 45%, then limitations become apparent to this stratagem of "diversion to storage". A more potent mechanism for ameliorating the pathological ingress of excess calories is is to uncouple respiration. A concept I explored here for PUFA.

What if sucrose does the same? Moderate levels, say 17%, allow fructose to enter cells without insulin mediated control. At this level I would expect fructose to generate enough ROS to limit insulin action by just the correct amount to down regulate glucose ingress to compensate for the energy from metabolised fructose.

If sucrose is very high, say 38.5% of calories, perhaps the unregulated fructose ingress cannot successfully offset enough of insulin's action on glucose ingress to balance the books. It looks like the solution in response to un-manageable caloric ingress might be to uncouple respiration so as to off-load the excess calories as heat.

Parallels between dose response to LA and fructose? Medium doses are dealt with by storage, high doses require uncoupling.

Some Surwit diets and D12451 combine maximally problematic levels of both fructose and linoleic acid.

These are things I'm thinking about at the moment.

Peter

Wednesday, May 19, 2021

Of mice and men (2) In the brain

Tucker emailed me this paper. It's gold dust.

I have many issues with the paper but I'll ignore those and get down to the nitty gritty.

Hypothalamic remodelling.

There is normally an on-going turnover of neurons in the hypothalamus concerned with energy balance regulation. Feeding a high fat diet (high PUFA with sucrose, D12451) to mice makes them become obese and also shuts down remodelling of their hypothalamic energy balance neurons.

Here is figure 3c. It's complicated:


Let's look at the solid boxes first

The mice in the grey box described as control were simply fed D12450B throughout the experimental period and have never been obese, haven't lost any weight and have normally functioning adipocytes.

The next three groups were made obese with D12451 and then slimmed down again, through spontaneously reduced appetite, with either a high protein diet (HPD), with D12450B (HCD, same as used for the control group throughout) or with F3666 (KD). Or they were allowed to stay fat on D12451 (solid purple box).

From the solid green, blue and red boxes we can see that being post-obese, using any spontaneous weight loss diet, produces some reduction in hypothalamic neural turnover cf never-obese controls.

We can also see from the purple solid box that staying fat on D12451 causes the greatest reduction in neural remodelling.

Next are the hatched boxes. If you cut calories involuntarily, on any diet, you always reduce hypothalamic neuronal remodelling. Whether you have been overweight or not. The effect is slightly less pronounced if you calorie restrict on non obesogenic diets but more pronounced if you calorie restrict on an obesogenic diet (D12451), hatched purple box.

On top of that you have to note that the effect of an ad lib obesogenic diet is exactly the same (bad) as calorie restricting on that same obesogenic diet.

If you are simply looking for a drug-able target you would want a linear association between weight and decreased neural remodelling in the energy centre of the hypothalamus. Drug the brain stem, eat crap, lose weight, sweet.

You don't get the straight line. It's a curve, like this:


I don't think the authors have any insight in to what is going on here.

Some of us have an adipocentric view of obesity.

D12451 causes obesity because it generates pathological insulin sensitivity in adipocytes and simultaneously raises insulin. Adipocytes take in excess lipid which results in obesity combined with hunger. The calories which have been eaten are "gone" in to adipocytes. You have to eat more. To loosely quote Gary Taubes "getting fat makes you eat more".

Your hypothalamus notices, it's well aware of this caloric loss.

Eating a non obesogenic control diet does not affect hypothalmic remodelling. Eating that exact same diet at 70% of necessary calories makes you hungry and does reduce remodelling.

Eating D12451 at any calorie intake leaves you with inadequate calories. You're hungry. Remodelling shuts down. Just like you are being starved, but more so.

The relationship between bodyweight and hypothalamic remodelling is a curve because hunger is a curve. Low bodyweight hunger through frank calorie restriction "feels" the same (at least to your hypothalamus) as having a high bodyweight due to excess caloric loss in to adipocytes.

Gaining weight is a CNS hypocaloric phenomenon due to failure of adipocytes to limit caloric ingress.

Think ROS.

Please don't try to drug your hypothalamus out of obesity. It will end in tears.

Peter

EDIT: TLDR decreased hypothalamic remodelling under hypocaloric conditions "locks" signalling in the "seek calories" mode. END EDIT.

Saturday, May 01, 2021

Feeling experimental?

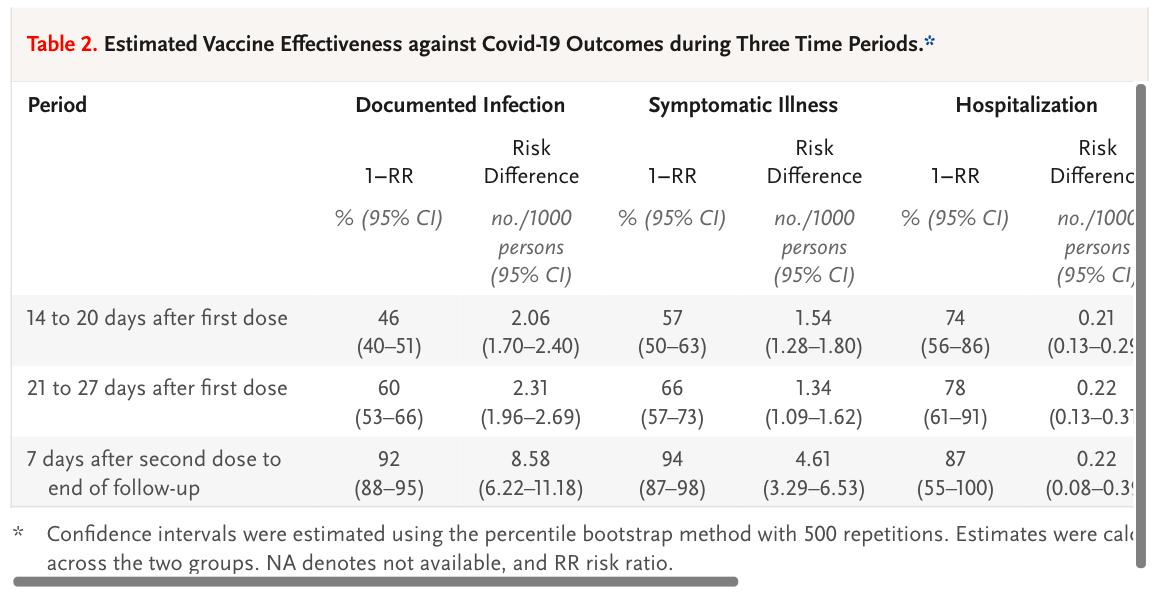
This is the observational study from Israel through their Pfizer vaccine roll out:

which has this excellent table showing some degree of vaccine efficacy:


Which, understandably, only starts at 14 days after first vaccination. No one would expect a vaccine to generate immunity sooner than 14 days. So we don't need to look at those initial 14 days. Interestingly, as well as excluding the first 14 days, they also excluded 26,000 care-home/housebound people and 25,000 health care workers, I've no idea why. I'd be really interested to see how the vaccine worked in elderly "crumbly" people and those who cared for them. But that's just me.

This next snippet is just a pre-print, and might stay that way. They simply reverse engineered one of the graphs in the above paper, did some basic calculations on the numbers at-risk vs infected and extracted the incidence of PCR positivity, "cases", in the earliest days of the vaccine roll out


and found, surprisingly, that people were more likely to test positive for SARS-CoV-2 in the two weeks after the vaccine compared to the non-vaccinated arm. The risk doubles. Like this:


There is a slightly sideways suggestion as to why this might occur:

"But there was a strong increase in incidence over the first week after the injection. If the increase in incidence during the first few days after immunization is a result of people being less careful after they have had their first injection, then the vaccine effectiveness after a single dose may be even greater."

ie people might have been rather less careful than they should been for the first week after the vaccine. Those Israelis are such party animals.

Now I've just picked up this peer reviewed study via twitter, again extracted from Israeli mass vaccination data:

Initial report of decreased SARS-CoV-2 viral load after inoculation with the BNT162b2 vaccine

looking at the viral load as assessed by PCR cycle threshold, from day 1 onwards after vaccination:


These people are looking at the PCR cycle threshold value for a positive test as a surrogate for viral load, ie how badly infected a person might be. Obviously, the lower the CT value the more virus is present. It just struck me that people presenting with a requirement for PCR testing 3 days after their vaccine had twice the viral load (CT drops from 25 to 24, ie a doubling of viral load) than at any other time point. This might be random chance, but may not be.

Next we can look at the elderly people in care homes in Denmark (again just a pre-print, but less controversial this time):


Incidence went up from 488 before vaccination to 760 in the first two weeks after vaccination, before improving progressively there-after. You can see in the right hand columns for vaccine efficacy that the two weeks after vaccination show a negative efficacy value.


but this time included the AZ vector vaccine too, this will be a generic effect.

Not so easy to make out in this study, everything is expressed in Odds Ratios, ie your risk of getting infected. Non-vaccinated individuals are considered at baseline risk, ie an OR 1.0 and are highlighted with a red circle. Just being "about to be vaccinated" people (blue circle) is massively protective. I know that sounds bizarre but the baseline and pre-vaccine people will be at differing times and infection rates vary greatly over time. A falling rate of population infection (due to Gompertz/seasonality, which control everything) is massively protective against infection. Being alive after the January peak is highly protective compared to living through the December rise.


Anyhoo, we next have days 0-7 post vaccine (green arrow), higher OR of testing positive soon after your vaccine. This worsens to the blue arrowed value for days 8-20 post vaccine before the vaccine finally kicks in as shown by the yellow arrow. I'm not going to criticise the vaccine but the yellow "arrow of success" looks pretty close to the blue circle of "about to be vaccinated". Fascinating.

This is one of the first assessments of the Pfizer vaccine from way back:

Safety and Immunogenicity of Two RNA-Based Covid-19 Vaccine Candidates

and this is supplementary figure S3 section a


The Pfizer vaccine is marketed at the 30microgram dose rate, that's the brown plots. Over days 1-3 the lymphocyte count drops precipitously. If I have a patient on chemo whose lymphocytes have dropped below 1.0 10^9/l I would be worrying about immunosuppression. The effect is gone by a week. They never checked if it happens after the second dose.


Edit:

It has been pointed out to me that figure S3a is actually BNT162b1 and the vaccine actually selected for marketing was (sensibly) BNT162b2, which has a much milder effect on the lymphocyte count. So I have to consider that lymphopaenia might not be the mechanism or, if it is still the mechanism, it will only apply to those at the lower end of the box and whisker plots. The plots from BNT162b2 are here, first in 18-55 year olds:


and here for the over 55 year olds


showing a very minor effect. I still ponder whether this might have a significant effect but obviously that question is wide open. The increased infection rate is too generic to be fluke, the question is more how relevant lymphopaenia might be as an explanation.

End edit.


Lymphocytes come in many flavours. Some are irrelevant to dealing with acute infections, some are critical. On initial exposure to a virus it is the non-specific parts of the immune system which save your life in the first few days. Never mind B cells or T cells, they are critical for long term effects. In the acute phase, where the immune system has met an unknown pathogen, it's lymphocytes like natural killer cells that are going to save you. It is impossible to overstate the critical nature of the lymphocytes of the innate arm of the immune system.

To differentiate T cells from B cells from NK cells requires immunohistochemistry. This wasn't done because the lymphopaenia was considered to be transient and of no clinical significance. Bloody hell.

Lymphocytes aren't there at normal levels in the first few days after a mRNA vaccination.

To get ill you still need to meet the virus. You will still look just like a COVID-19 case, who was "probably incubating" at the time of vaccination, or went out partying under lockdown on the day you got your shot. You will still come up positive on PCR, probably with a high viral load showing as a positive result at a low cycle threshold. You might still die.

All because you were acutely immunosuppressed when you met the virus. By the vaccine. Only for a few days.

Just a little browse through Pubmed-land pulls up fresh herpes infection in people already on immunosuppressive drugs for arthritis (Israel again) after COVID-19 vaccination. Some nasty pictures in the paper

Herpes zoster following BNT162b2 mRNA Covid-19 vaccination in patients with autoimmune inflammatory rheumatic diseases: a case series

and also, browsing the FDA commentary on the early trials

Emergency Use Authorization (EUA) for an Unapproved Product Review Memorandum

I picked up this line:

"Suspected COVID-19 cases that occurred within 7 days after any vaccination were 409 in the vaccine group vs. 287 in the placebo group."

These are people who looked like they had COVID-19 soon after vaccination but did not. They were PCR tested (sometimes very repeatedly) at high PCRct and were always negative. Call them ILI, influenza like illnesses. An excess in the week after vaccination occurred. Supportive of an acute immunosuppression post vaccination. It's usually SARS-CoV-2 that gets you but any other bug can do the job too.

Does any of this matter?

Maybe.

Here in the UK we had a wave of COVID-19 sweep much of the country in the spring 0f 2020. It ended largely due to the end of the winter respiratory virus season and it failed to fully penetrate to the north of England. The virus went on vacation in the summer, as respiratory viruses do. There was a finishing off of the first wave in the autumn, mostly in the northwest then the northeast. Then it started to peter out through November.

Personally I was expecting a mild winter respiratory virus season because the gross mis-management of the situation in nursing homes earlier in the year meant that many of the people who would normally have been going to die of influenza over Christmas had already been killed in the first COVID wave and its autumn residuals. And there was minimal influenza.

This didn't happen. In early December there was a modest upswing in cases, of COVID-19 this year as it was the dominant virus at the time. Then in mid December all hell broke loose.

It didn't matter what the COVID incidence was doing at a given location; it could be stable, rising or falling, there was a surge. It was big and the shape of the surge was exactly the same in all areas. The data came and went on twitter and I never screen-shotted it. Someone recently put up a related graph of the percentage positive tests which is okay but doesn't show the spectacular shape and synchrony of the absolute numbers of positive PCR test results. Here's the picture I have, best I can find:


And here the red line marks the start of vaccination roll-out and the blue line marks the start of the surge:


Here's the graph stretched out a little to show the linear rise in positivity, in all areas, over less than a week:


I'd forgotten about these weird sudden implausible rises in infection. I'd assumed the government had changed something about the PCR protocol (which they did do in December, to catch the B117 variant which spectacularly failed to kill everyone in Kent). What rekindled my interest was India.

I think these graphs are from Ted Petrou on twitter


The rises are not as synchronous as they were in the UK last December but the shape of the curves at the right hand end of the graphs is remarkably familiar. India is huge. Vaccine roll out will not be as synchronous as it was on our tiny island off the coast of Europe. Whatever India was doing before their vaccine roll out, maybe they should have just stuck with that.

A bit of an addendum:

In the UK we largely know when people received their vaccine doses, after all they're going to be needed for vaccination passports for as long as Bojo feels like imposing them. Probably for ever.

I never, ever, expected to see what vaccination does to illness, hospitalisation and death over the first few weeks because I was pretty sure it would be appalling. It was.

So I'm utterly amazed to see this:


The study is looking at hospitalisations and deaths related to time since vaccination in a cohort being followed as part of the study. You have to be ill enough to be hospitalised to be in the study so this helpfully excludes those massive numbers of false positive PCR results being generated in December before the PCRct was finally dropped from over 40 to a more reasonable 30 (still too high). These people were ill, and they were ill with SARS-CoV-2. Genuine cases as opposed to "cases".


As the CO-CIN researchers state

"Given that the median incubation period is 5 days, the distribution indicates that most vaccinated hospitalised patients were infected around the time of vaccination, and the remainder after vaccination but before immunity had developed"

Also included is what happened to anyone's granny (A UK tier 2 category patient) if she picked up SARS-CoV-2 in the immediate aftermath of her vaccine. About 10% of these tier 2 patients didn't survive.


How could vaccination trigger infection? CO-CIN state the normal explanation:

"Elderly and vulnerable people who had been shielding, may have inadvertently been exposed and infected either through the end-to-end process of vaccination, or shortly after vaccination through behavioural changes where they wrongly assume they are immune"

Which translates as they got infected at their vaccination centre. Or these elderly people went to Israeli-style parties, during lockdown, starting on the day of their first vaccine dose. Wild things, those folks in nursing homes.

We had a winter resurgence of COVID-19. It became an epic disaster as a direct result of the immunosuppressive vaccine program being started while SARS-CoV-2 was the prevalent virus. People went through a vaccine centre where SARS-CoV-2 was persisting in aerosol form in the local environment.

No one seems to have considered that the vaccine might be directly immunosuppressive. For young fit healthy people this might not matter. In a nursing home it's a death sentence for many. They died.

Someone needs to tell the Indian government. And maybe the Japanese government too, before they cancel the Olympics.

I hope we're all enjoying being part of a global drug trial based on 40,000 fit healthy people observed for two months in mid summer. The UK government is, as in Israel, going to coerce any unwilling "volunteers" to make them take part in this on-going experiment. Thank goodness we have the Nuremberg Code, for what that is worth here.

Peter


PS, from Australia:

"Western Australia's latest cases stem from a hotel quarantine security guard in his 20s who has tested positive to COVID-19 and was potentially infectious in the community for four days.

State health authorities said the guard, who recently received his first dose of the Pfizer COVID-19 vaccine, worked on the same floor as two other positive cases from the United States and Indonesia."

No laughing. It's not funny.