Time to talk about insulin signalling, metformin and the phosphorylation of AKT.
I borrowed this image

from this paper
because, unlike most images you will pull out by searching "insulin cascade", this one actually features a role for ROS and so forms a good basis for discussing metformin. So once agin it's PowerPoint doodle time. I'm going to miss out everything from the paper about anti-oxidants and PGC-1𝛼 etc.
First of all let's simply reduce the diagram to the canonical insulin signalling pathway by using a few blottings out:

In the simplistic world of insulin signalling, insulin arrives and this happens:

As part of the process AKT is phosphorylated and this is one of the core signals to activate the translocation of GLT4 and CD36 to the cell surface, facilitating caloric ingress:

There are several AKTs and they can be phosphorylated in various places but the simple message is that
Insulin -> insulin cascade -> pAKT -> caloric ingress
It is now very well accepted that the trigger for this cascade is the generation of ROS by NADPH oxidase 4 (NOX4) in response to the docking of insulin with its receptor. Like this:

Of course the glucose and fatty acids which enter the cell have to go somewhere so we can add in a mitochondrion:

which produces its own ROS

There is also a signalling cascade which carries information about these ROS. My supposition is that low levels of mitochondrial ROS act, as do those from NOX4, to facilitate the activation of insulin signalling.

However once the cell is calorie replete ROS generation rises markedly and the resulting generated high level of ROS acts to shut down insulin signalling at the insulin receptor substrate 1 (IRS1 on the diagram) point.

At this stage the whole insulin cascade stops functioning, as it should, because the cell is calorie replete. As part of this shutting down process the level of phosphorylation of AKT cannot be increased, no matter how much insulin is applied:

Think about what is happening. There is nothing wrong with the system. The failure to further phosphorylate AKT is not a fault for some drug developer to "correct". It is the direct result of evolution happening on to the ideal system for monitoring and controlling calorie ingress.
The substance which is the best for a cell to monitor, for maximal survival, is mitochondrial superoxide (+/-H2O2).
It's not insulin, it's not pAKT, it's not ATP, it's not NADH.
It is ROS.
So we can observe that phosphorylation of AKT, as a core part of the activation system for insulin signalling, is only allowed to occur provided the resultant ROS generation is within evolutionarily acceptable limits.
Now let's revisit
and add some detail to this graph:

I have pointed out in the past that the three concentrations of insulin used to generate this graph are five times, seventeen times and one hundred and seventy times the approximate upper limit of physiological exposure. All three levels produce exactly the same level of AKT phosphorylation because all three concentrations produce the maximal ROS tolerable to the cell. These ROS disable signalling at the level of IRS1.
I'm now going to modify the above diagram to include just the red box and stretch it to make it easier to see:

and add in some imaginary, more physiological, insulin concentrations:

I've assumed insulin in cell culture acts within the same five minutes as the supra-maximal doses do and the amount of pAKT formation stays near constant once set, as it does for supra-maximal exposure. These features may not be strictly correct.
If we wanted to construct an imaginary dose response curve it would look like this, here we are converting the above graph in to one showing the amount of phosphorylation of AKT produced by a given concentration of insulin. Again, the curve will not be accurate but the principle will be. As a rule of thumb 1000pM of insulin, ie 1.0nM, is peak insulin exposure after an high carbohydrate meal in an healthy person, which lets me put some very approximate absolute levels of insulin exposure:

It is quite possible to move the horizontal red line of response to supra maximal insulin exposure up or down. If you are insulin "resistant" you will have less pAKT at supramaximal insulin exposure. If you are insulin sensitive you will have more.
Now it's very simple. If you wanted a single measure of "insulin resistance" just look at the maximum level of pAKT under extreme hyperinsulinaemic conditions. If pAKT is low this signifies inadequate maximal insulin signalling and so insulin resistance.
If pAKT is high this signifies insulin sensitivity. This is the concept encapsulated by the hyperinsulinaemic euglycaemic clamp from back in the days when measuring AKT and pAKT involved more than buying a kit from Sigma-Aldrich.
All of which is missing the point. Completely.
What is actually important is the level of ROS generation from the mitochondria.
Metformin: What does it do? At pharmacological plasma levels it inhibits the action of the glycerophosphate shuttle. It reduces the conversion of NADH to FADH2 by this shuttle. Less FADH2 means less reverse electron transport (RET) as judged by the FADH2:NADH ratio. If this results in a pharmacologiocally reduced level of ROS under metformin this will allow more glucose signalling (ie pAKT) before cellular "satiety" kicks in due to generation of high physiological ROS to finally shut down IRS1 functionality. Like this

So given that single measurement of pAKT (or the rate of glucose infusion needed for euglycaemia under the last 40 minutes of an hyperinsulinaemic clamp) then metformin is, absolutely, an insulin sensitising agent. But that's because you are looking at pAKT, not ROS.
The level of ROS at for both plateaux in the above graph will be identical. That is what evolution has determined to be the best peak "target" level of ROS. Metformin blunts ROS production so allows more pAKT to be formed before ROS generation becomes high enough to shut down insulin signalling.
I could suggest that metformin allows more insulin mediated ROS at peak physiological (or above) insulin exposures. That seems quite simple.
But is the above metformin graph actually correct? Partial reduction of ROS by inhibiting mtG3Pdh to allow a greater peak insulin effect is one thing. But what about reducing ROS from physiological levels of insulin exposure, where ROS are activating to insulin signalling? We are now looking at modifying this red arrow process:

So if we lower ROS under these circumstances using metformin we will decrease insulin signalling. So our graph should actually look like this:

The blue section of the metformin curve has reduced ROS so signals less insulin pathway activation compared to control cells. ROS never peak anyway, and so are simply proportionally reduced under metformin.
So "normal" people, who run their metabolism on the blue dashed part of the metformin curve will show as "paradoxically" worsened insulin signalling. As we saw here:
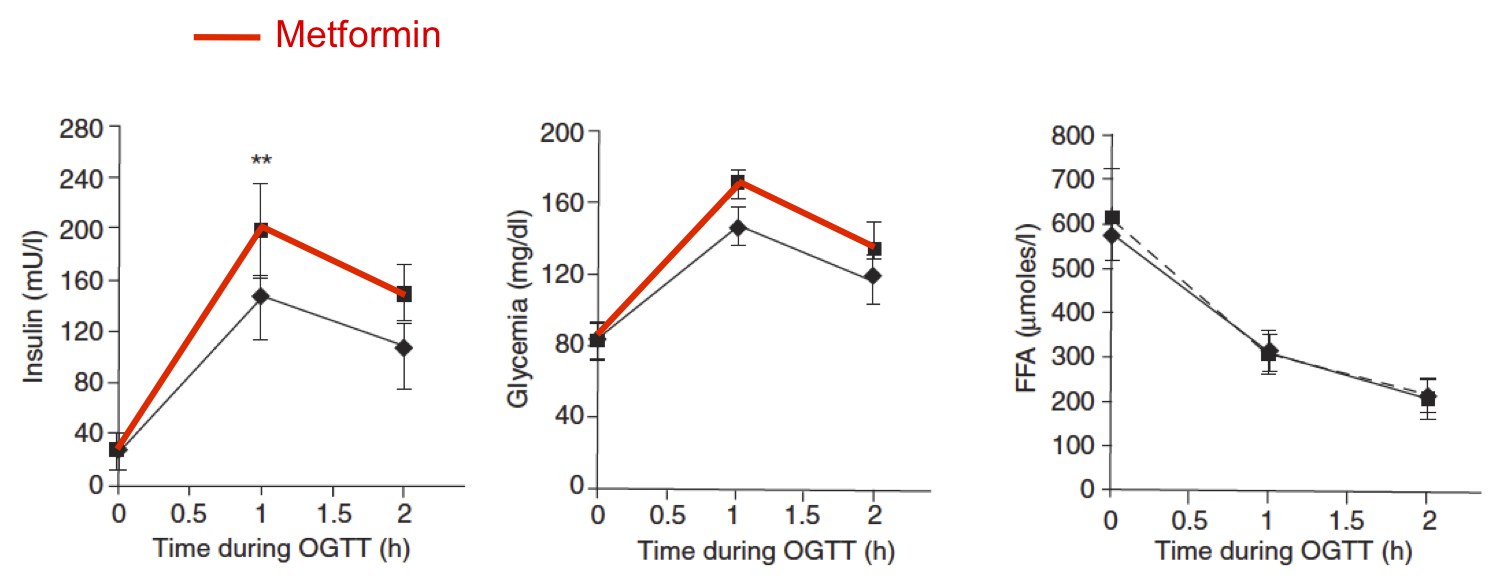
Now let's consider DMT2. At its simplest level diabetes is the over distension of adipocytes secondary to the insulin sensitising effects of linoleic acid in combination with an insulinogenic diet. Once adipocytes are large enough basal lipolysis allows FFA release which cannot be suppressed by insulin.
If you have elevated fatty acid oxidation which cannot be reduced by insulin acting on adipocytes then ROS will be being generated at all times. There will be elevated baseline ROS, being generated from this fatty acid oxidation. If we add glucose and insulin, as in an OGTT or an hyperinsulinaemic euglycaemic clamp, the additional ROS from this calorie source will not have to generate very much extra ROS to shut down insulin signalling at IRS1 and so limit pAKT.
I repeat, it's the ROS that count. Oxidising fatty acid generates ROS without phosphorylating AKT. There is then only limited "scope" in the ROS budget before insulin signalling (hence pAKT and/or glucose infusion under clamp) has to be shut down. Not because the cells are "insulin resistant", it's because they have largely already met their ROS quota from fat. Which should not be there, fat supply should shut down immediately with even a tiny increase in adipocyte insulin exposure. But excess FFA will always be supplied (and oxidised) if there is unstoppable basal lipolysis.
Under these circumstances pAKT will be low because the ROS quota is nearly full to begin with. Adding metformin will reduce the generation of ROS from the glycerophosphate shuttle and so allow more "room" in the ROS budget which will allow more AKT phosphorylation and more glucose uptake before the ROS quota is used up. Things appear to improve for DMT2 under metformin's action.
TLDR: Is metformin insulin sensitising? Wrong question. Ask instead what metformin does to the generation of ROS. You can ask the same question about BAM15, DNP and even semaglutide.
Balancing the ROS budget explains everything.
I'll stop now.
If anyone has a better explanation I'm all ears.
Peter