Sunday, April 23, 2023

Fructose (03) NOX vs RET

This post is not about any specific study. It just gives the background to understand the post after, which is already written but I need to sit on it for 24h and correct the worst of the typos/logic errors. Okay...

Before we can go on to understand the role of fructose as an insulin sensitiser/mimetic I think a little more explanation of NOX enzymes might be in order. So this is a very simple view of NOX and ROS vs reverse electron transfer through complex I and ROS.

So let's begin here again, don't forget this is the cell surface, mitochondria will reappear further down the page:


I want to start with the red square which we can pull out thus:


The basic story is that insulin "talks" to NOX4, activates it and the resulting ROS deactivate a number of (inhibitory) phosphatases, which allows the insulin signalling cascade to take off. That little red arrow needs some elaboration and is an oversimplification.

I have mentioned before that the basic NOX core looks extremely primordial (thought it appears it is actually an eukaryotic invention) and it is better represented like this, taken from here:

The NOX family of ROS-generating NADPH oxidases: physiology and pathophysiology


The NADPH binds to a protein containing an FAD moiety which accepts a pair of electrons to form FADH2, temporarily. This seems to be a "bolt-on" NADPH oxidase which can supply high energy electrons to any process you care to bolt the oxidase on to. Here it feeds electrons to a "wire" to the outside of the cell. The six transmembrane helices form a tunnel containing two haem iron groups which are the "wire". One electron at a time travels from FADH2 "down hill" towards the exterior of the cell. But to fully traverse the cell membrane it is travelling against the cell membrane voltage and can only make it if oxygen is docked on to the outer end of the "wire" as terminal acceptor, like this:


Obviously superoxide, as a charged particle, is not going to re-enter the cell. Some NOX members have another "bolted-on" sub-unit which means the NOX produces H2O2 rather than superoxide, which has a much better chance of entering the cell. There is also extracellular SOD3 which can dismutate superoxide to H2O2 to re-enter the cell.


So we can now look at the activation of insulin signalling again but with a modified NOX doodle:


There might be quite a lot of arrows but the set-up isn't really that complicated. The core message is that the ROS which activate the insulin cascade are of extracellular origin. We will see later that they can influence more distant intracellular sites but I want to stay with simple activating physiology of the insulin cascade here for today. As far as insulin signal activation the triggering ROS are of extracellular origin. Hence the location of the "ROS" labels in the initial image from which the above doodle is derived.

Next we have to think of fasting. Here's a view of ROS signalling under fasting conditions. FFAs can be between 1000 and 3000micromol/l in healthy people under an extended fast. To survive under these conditions it is helpful to reduce both the absolute level of insulin and the level of signalling in the insulin cascade from whatever insulin is present. This is how it works:


The oxidation of FFAs will generate ROS by reverse electron transfer through complex I irrespective of mitochondrial membrane potential (as long as this is within physiological limits) and will be a primary mechanism for resisting glucose usage wherever FFAs can substitute to allow glucose sparing for tissues where glucose is an essential requirement. Of course long chain saturated fats do this best but all mitochondrially targeted fats do it to some degree.

Before I pause to make some more doodles on more interesting subjects we just have to add in how FFA supply is regulated. At the start of an OGTT glucose is rapidly absorbed and penetrates to the systemic circulation and stimulates insulin secretion (pax GLP-1 and related overlays to this system) from the pancreas. In healthy people this insulin might drop FFAs as low as 50micromol/l:


This has nothing to do with an individual cell, it's a distant effect of insulin acting on adipocytes to suppress lipolysis and so suppress FFA supply to the whole body. Which will markedly reduce mitochondrially generated ROS. Any residual mitochondrial FFA derived ROS might even be at insulin facilitating levels:


Ultimately the above doodles describe models, which are simple extremes and only distantly relevant to the integrated performance of the complexities of glucose and fatty acid derived energy production and ROS control. But they form a reasonable framework to go on to explore the findings in Cherrington's human OGTT studies.

TLDR

Insulin -> NOX -> cell surface low ROS -> activating

FFAs -> RET -> mitochondrial high ROS -> inhibiting

Monday, April 17, 2023

Fructose (02) Obesogen

I guess we could do worse than to being this post here;


It's a follow on study after an initial dog study from 1998 which demonstrated that, much like glucose, in a tightly controlled somatostatin/insulin/glucagon model, low dose fructose markedly suppresses hepatic glucose output and markedly increases glycogen formation in healthy dogs. On a fixed insulin background, low dose fructose behaves as an insulin mimetic.

This follow on study in 2002 used hormonally intact dogs instrumented for portal vein, hepatic vein, femoral vein and femoral artery access. In addition they were cannulated to allow intra-duodenal infusion of glucose or glucose + fructose. This gets rid of all of the pesky delay in gastric emptying involved in an OGTT and allows time to assess effects under steady state conditions rather than the brief and dynamic changes which occur under an OGTT. Between the first and second canine studies the group had performed a couple of sets of human OGTT studies +/- fructose with somewhat challenging results, which I suspect is what led to this latest canine study, to really control as many variables as practical.

Aside: There is a horrible typo in the plasma glucose graphs throughout the study. For glucose they clearly mean milli moles/l, not micro moles/l. Arghhh. I think the fructose at 100micromoles/l is likely to be correct. I can't face trying to confirm whether their infusion rates are correct re micro vs milli. Ugh. I think their data are fine per se, unfortunate re typos. End aside.

The intra-duodenal glucose infusion was pitched to generate a modest, stable hyperglycaemia at ~10mmol/l. In the intervention section this glucose infusion remained unchanged at 44.4μmol/kg/min but an additional infusion of fructose was added at 2.2μmol/kg/min, ie around 5% fructose in addition to the original glucose. This is what happened to the systemic plasma glucose levels:


If anyone had developed a drug to produce this effect in diabetic patients it would be impressive. But that's not all. Look at what insulin levels were needed to achieve that drop in blood glucose:


Adding in 2.2μmol/kg/min of fructose to an hyperglycaemic glucose infusion profoundly lowers the insulin levels needed to maintain a modestly reduced hyperglycaemia value. In a hormonally intact dog preparation.


That's amazing if correct. Fructose appears to be profoundly insulin "sensitising" or mimicking.


Almost nothing is being "done" with the fructose. It enters the liver, drops though fructolysis and is excreted largely as lactate, well in excess of that produced by the glucose alone. I hope we're all aware that fructolysis bypasses those regulatory steps which make glycolysis a tightly regulated process. Here's the lactate change:


Next we can quickly doodle in the fructolysis pathway taken from here

Fructose Metabolism in Cancer

which has this as a generic cell capable of metabolising fructose. In the liver the various GLUTs will be different but the same principle applies:


We can add in fructolysis with its unregulated, high flow pathway to lactate as typically seen in our current discussion of hepatocytes. Like this:


Equally we can put in the tightly regulated glycolysis route to either ox phos and/or lactate, usually a bit of both. But regulated by pH, citrate, ATP or oxygen availability.


We can put both pathways in together and throw in the insulin receptor too:


We are now in a position to add in the core features to an understanding of what is going on. Like this:


and then we can fade the background to let us concentrate on the generation of ROS:


Here we have the situation under intra-duodenal glucose infusion alone. ROS are being generated by glucose ingress per se using NOX2 and also by insulin docking with the insulin receptor to activate NOX4. Both insulin level and the entrance of glucose in to cells without insulin are tightly controlled.

Neither glucose nor insulin are the signal to activate the insulin signalling cascade. That is purely the prerogative of ROS, at physiologically appropriate levels. The end result is a glucose value of around 10mmol/l and an insulin value at around 250pmol/l.

This is what happens if we add 2.2μmol/kg/min of fructose to the glucose infusion. We achieve a portal vein fructose concentration of 100μmol/l which will generate significant ROS, in direct proportion to the rate of entry of fructose to the cell, which will be high:


The fructose generated ROS will increase the ROS signal. This is the activator of the insulin cascade. The ROS signal will result in the phosphorylation of AKT, the activation of glycogen synthesis and will decrease the penetration of glucose past the liver and in to the systemic circulation. Systemic glucose will fall, less pancreatic secretion of insulin will be needed.

We get what we see in the study.

My personal definition of an obesogenic drug is one which activates "insulin" signalling in the absence of insulin. Fructose generates "unexpected" ROS when entering liver cells at a concentration of 100μmol/l. I think it is perfectly likely that, should one achieve an adipocyte exposure of 100μmol/l of fructose, that a similar effect might occur.

In Laughlin's 2014 review


there is the suggestion that peak systemic fructose concentrations healthy men after a high sugar exposure might be about 0.5mmol/l, ie 500μmol/l and a fasting level might be a fraction of a μmol/l.

There are a number of studies showing fasting fructose levels as high as 2.0mmol/l (ie 100 times Laughlin's accepted level) with post fructose loading reaching over 17.0mmol/l. That makes life easy for everyone. If you want to show fructose is harmless or beneficial you chose the low studies. If you want toxicities you choose the high studies.

But are low doses of fructose beneficial at all? Is insulin cascade activation good or bad? Are the benefits of reduced absolute insulin exposure offset by the ROS mediated activation of insulin cascade?

Whichever fructose measurement camp you fall in to, a normal human being can easily maintain systemic fructose levels > 100μmol/l in the aftermath of even a modest fructose load, which in the dog studies I consider generates enough ROS to be markedly facilitating of what we could call an insulin sensitising or mimetic exposure. Perhaps we should apply this to adipocytes.

Does fructose make you insulin sensitive? Of course it does. Does activating insulin signalling make you fat? Of course it does.

Except, of course, when it does the opposite.

Peter

Friday, April 14, 2023

Fructose (01) There's a signal

If we start from this diagram


produced in 2006, well ahead of its time in here:

Role of Insulin-Induced Reactive Oxygen Species in the Insulin Signaling Pathway

we can add in the standard ROS signalling pathway, triggered by insulin, without any hint of speculation thus:


Our next move is to look beyond the insulin signal and concentrate more on the glucose -> NOX (NADPH oxidase) ignoring the mitochondria, ie these components of the diagram


and especially consider the highlighted process in red.

Nowadays we have a little more information, taken from here


As they conclude

"Our results showed that acute Hi-Glu induces cardiac myocyte ROS production via O-GlcNAcylation of CaMKIIδ and consequent activation of NOX2 ROS production in the cytosol, but not in the mitochondria."

which lets us add a little detail to the diagram:


So it's worth noting that severe (30mM) hyperglycaemia can activate NOX2 ROS generation in intact mice or their isolated cardiac myocytes through a now determined mechanism without exogenous insulin. In general this is a Bad Thing. Like this:


That's fine, as far as it goes. But it's mice or cells. And 30mM glucose.

Does this happen in real live people? Well, that depends. It's not easy but if you take some normal people, paralyse their hormonal signalling systems with somatostatin combined with a replacement infusion of basal insulin/glucagon/growth hormone you can certainly use an abrupt switch from plasma glucose at 5mmol/l to 10mmol/l and see what happens. In the control group at least, from the ancient days of 2002, all that happens is that, as assessed by glucose tracer, 10mmol/l of "hyperglycaemia" suppresses hepatic glucose output. Without increased insulin exposure and hence without any change in insulin receptor mediated signalling.

Mild hyperglycaemia -> suppressed hepatic glucose output in normal people.

Important: Mild hyperglycaemia appears to be a "functional insulin mimetic".

Without any increase in insulin exposure I would predict that a small rise in plasma glucose will result in some phosphorylation of AKT, by non-insulin mediated ROS generation.

We can now explain this finding in the control group of this paper, ignoring the (beneficial) role of [redacted] in type 2 diabetes, to which I will return on another day. 

[Redacted] improves the ability of hyperglycemia per se to regulate glucose production in type 2 diabetes

We can posit this:


Now it's time to just peek at fructose [which I redacted previously] to see if we can shed some light on to its function in health/disease and ask:

Does fructose cause obesity? Yes and no.

Does it cause insulin resistance without obesity? Yes and no.

Obviously the correct answer is that we are asking the wrong questions.

To answer any questions about insulin "sensitivity/resistance" we have to be asking about ROS. Exactly the same questions about fructose and ROS generation as we already have the answers to about glucose 10mmol/l vs 30mmol/l and ROS generation.

First off let's make a sweeping assumption that fructose exposure is like glucose exposure. This is almost certainly correct. Something like this:


No one has a mechanism in terms of which intermediate signal, which kinase or which of the NOX(s) are involved. Yet. That will come. At least one NOX is where the ROS originate from.

If you are a rat/mouse on dry chow and your only access to any sort of fluid contains either 10g or 20g of fructose in every 100ml of water this is what is going to happen. There is an essentially infinite supply of such studies, just search Pubmed for "Fructose" and "ROS":


What are much, much harder to find are the studies which suggest that this is a Real Thing:


There is quite a literature supporting this latter image too but none of it shows under "ROS" searching. I gained access to it through this review, to which I am very grateful:

Normal Roles for Dietary Fructose in Carbohydrate Metabolism

It's from 2014 and the author has no concept of insulin being a superficial over-laid veneer on the underlying ROS signalling system, or even that there is an ROS signal involved. And the literature cited is from pre-pAKT days, so we have to reverse engineer the gross rodent/human studies to think about them in terms of ROS as the core signal. Even today we seem have essentially no idea of how fructose signals to NOX to generate ROS.

But it does.

Peter

Thursday, April 06, 2023

Metformin (15) ROS

Time to talk about insulin signalling, metformin and the phosphorylation of AKT.

I borrowed this image


from this paper

An Intimate Relationship between ROS and Insulin Signalling: Implications for Antioxidant Treatment of Fatty Liver Disease

because, unlike most images you will pull out by searching "insulin cascade", this one actually features a role for ROS and so forms a good basis for discussing metformin. So once agin it's PowerPoint doodle time. I'm going to miss out everything from the paper about anti-oxidants and PGC-1𝛼 etc.

First of all let's simply reduce the diagram to the canonical insulin signalling pathway by using a few blottings out:


In the simplistic world of insulin signalling, insulin arrives and this happens:


As part of the process AKT is phosphorylated and this is one of the core signals to activate the translocation of GLT4 and CD36 to the cell surface, facilitating caloric ingress:


There are several AKTs and they can be phosphorylated in various places but the simple message is that

Insulin -> insulin cascade -> pAKT -> caloric ingress

It is now very well accepted that the trigger for this cascade is the generation of ROS by NADPH oxidase 4 (NOX4) in response to the docking of insulin with its receptor. Like this:


Of course the glucose and fatty acids which enter the cell have to go somewhere so we can add in a mitochondrion:


which produces its own ROS


There is also a signalling cascade which carries information about these ROS. My supposition is that low levels of mitochondrial ROS act, as do those from NOX4, to facilitate the activation of insulin signalling.


However once the cell is calorie replete ROS generation rises markedly and the resulting generated high level of ROS acts to shut down insulin signalling at the insulin receptor substrate 1 (IRS1 on the diagram) point.


At this stage the whole insulin cascade stops functioning, as it should, because the cell is calorie replete. As part of this shutting down process the level of phosphorylation of AKT cannot be increased, no matter how much insulin is applied:


Think about what is happening. There is nothing wrong with the system. The failure to further phosphorylate AKT is not a fault for some drug developer to "correct". It is the direct result of evolution happening on to the ideal system for monitoring and controlling calorie ingress.


The substance which is the best for a cell to monitor, for maximal survival, is mitochondrial superoxide (+/-H2O2).

It's not insulin, it's not pAKT, it's not ATP, it's not NADH.

It is ROS.

So we can observe that phosphorylation of AKT, as a core part of the activation system for insulin signalling, is only allowed to occur provided the resultant ROS generation is within evolutionarily acceptable limits.

Now let's revisit

Insulin Resistance Induced by Hyperinsulinemia Coincides with a Persistent Alteration at the Insulin Receptor Tyrosine Kinase Domain

and add some detail to this graph:


I have pointed out in the past that the three concentrations of insulin used to generate this graph are five times, seventeen times and one hundred and seventy times the approximate upper limit of physiological exposure. All three levels produce exactly the same level of AKT phosphorylation because all three concentrations produce the maximal ROS tolerable to the cell. These ROS disable signalling at the level of IRS1.

I'm now going to modify the above diagram to include just the red box and stretch it to make it easier to see:


and add in some imaginary, more physiological, insulin concentrations:


I've assumed insulin in cell culture acts within the same five minutes as the supra-maximal doses do and the amount of pAKT formation stays near constant once set, as it does for supra-maximal exposure. These features may not be strictly correct.

If we wanted to construct an imaginary dose response curve it would look like this, here we are converting the above graph in to one showing the amount of phosphorylation of AKT produced by a given concentration of insulin. Again, the curve will not be accurate but the principle will be. As a rule of thumb 1000pM of insulin, ie 1.0nM, is peak insulin exposure after an high carbohydrate meal in an healthy person, which lets me put some very approximate absolute levels of insulin exposure:


It is quite possible to move the horizontal red line of response to supra maximal insulin exposure up or down. If you are insulin "resistant" you will have less pAKT at supramaximal insulin exposure. If you are insulin sensitive you will have more.

Now it's very simple. If you wanted a single measure of "insulin resistance" just look at the maximum level of pAKT under extreme hyperinsulinaemic conditions. If pAKT is low this signifies inadequate maximal insulin signalling and so insulin resistance.

If pAKT is high this signifies insulin sensitivity. This is the concept encapsulated by the hyperinsulinaemic euglycaemic clamp from back in the days when measuring AKT and pAKT involved more than buying a kit from Sigma-Aldrich.

All of which is missing the point. Completely.

What is actually important is the level of ROS generation from the mitochondria.

Metformin: What does it do? At pharmacological plasma levels it inhibits the action of the glycerophosphate shuttle. It reduces the conversion of NADH to FADH2 by this shuttle. Less FADH2 means less reverse electron transport (RET) as judged by the FADH2:NADH ratio. If this results in a pharmacologiocally reduced level of ROS under metformin this will allow more glucose signalling (ie pAKT) before cellular "satiety" kicks in due to generation of high physiological ROS to finally shut down IRS1 functionality. Like this


So given that single measurement of pAKT (or the rate of glucose infusion needed for euglycaemia under the last 40 minutes of an hyperinsulinaemic clamp) then metformin is, absolutely, an insulin sensitising agent. But that's because you are looking at pAKT, not ROS.

The level of ROS at for both plateaux in the above graph will be identical. That is what evolution has determined to be the best peak "target" level of ROS. Metformin blunts ROS production so allows more pAKT to be formed before ROS generation becomes high enough to shut down insulin signalling.

I could suggest that metformin allows more insulin mediated ROS at peak physiological (or above) insulin exposures. That seems quite simple.


But is the above metformin graph actually correct? Partial reduction of ROS by inhibiting mtG3Pdh to allow a greater peak insulin effect is one thing. But what about reducing ROS from physiological levels of insulin exposure, where ROS are activating to insulin signalling? We are now looking at modifying this red arrow process:


So if we lower ROS under these circumstances using metformin we will decrease insulin signalling. So our graph should actually look like this:


The blue section of the metformin curve has reduced ROS so signals less insulin pathway activation compared to control cells. ROS never peak anyway, and so are simply proportionally reduced under metformin.

So "normal" people, who run their metabolism on the blue dashed part of the metformin curve will show as "paradoxically" worsened insulin signalling. As we saw here:


Now let's consider DMT2. At its simplest level diabetes is the over distension of adipocytes secondary to the insulin sensitising effects of linoleic acid in combination with an insulinogenic diet. Once adipocytes are large enough basal lipolysis allows FFA release which cannot be suppressed by insulin.

If you have elevated fatty acid oxidation which cannot be reduced by insulin acting on adipocytes then ROS will be being generated at all times. There will be elevated baseline ROS, being generated from this fatty acid oxidation. If we add glucose and insulin, as in an OGTT or an hyperinsulinaemic euglycaemic clamp, the additional ROS from this calorie source will not have to generate very much extra ROS to shut down insulin signalling at IRS1 and so limit pAKT.

I repeat, it's the ROS that count. Oxidising fatty acid generates ROS without phosphorylating AKT. There is then only limited "scope" in the ROS budget before insulin signalling (hence pAKT and/or glucose infusion under clamp) has to be shut down. Not because the cells are "insulin resistant", it's because they have largely already met their ROS quota from fat. Which should not be there, fat supply should shut down immediately with even a tiny increase in adipocyte insulin exposure. But excess FFA will always be supplied (and oxidised) if there is unstoppable basal lipolysis.

Under these circumstances pAKT will be low because the ROS quota is nearly full to begin with. Adding metformin will reduce the generation of ROS from the glycerophosphate shuttle and so allow more "room" in the ROS budget which will allow more AKT phosphorylation and more glucose uptake before the ROS quota is used up. Things appear to improve for DMT2 under metformin's action.

TLDR: Is metformin insulin sensitising? Wrong question. Ask instead what metformin does to the generation of ROS. You can ask the same question about BAM15, DNP and even semaglutide.

Balancing the ROS budget explains everything.

I'll stop now.

If anyone has a better explanation I'm all ears.

Peter

Monday, April 03, 2023

Obesogens

How might we define an obesogen?


we have this well worn graph:


We can clearly observe that if we expose adipocytes to any local ROS generation of the equivalent to around 0.3-1.0mM of hydrogen peroxide we can perform exactly the function of insulin on glucose uptake and oxidation in the complete absence of insulin itself.

The effect of ROS on glucose incorporation in to fatty acids was reported by the same group a couple of years previously.

Cu ++ -dependent thiol stimulation of glucose metabolism in white fat cells

At this point they had not realised that hydrogen peroxide (+/- superoxide I guess) was the essential insulin "mimetic" and were still interested in sulphydryl groups per se as the mediator of insulin signalling (understandably so, just look at the structure of insulin itself). Once they realised that the Cu2+ ion was essential in combination with a sulphydryl source I think the penny dropped that ROS were the active essential component, hence the 1974 paper. Given the tools they had in the 1970s these are very deep insights. You don't see that nowadays.

Anyway, if we combine the ideas from both papers we can ask very simple questions about exogenous obesogens.

Just consider Fine Particulate Matter (FPM), an absolute hot topic in 2023 (thanks to Gabor Erdosi for the link and the hints to go and Pubmed the other two)

Fine particulate matter induces adipose tissue expansion and weight gain: Pathophysiology


and FPM even phosphorylates AKT, just like insulin:

Urban particulate matter activates Akt in human lung cells

and, slightly less topical but still good, endocrine disruptors

Induction of oxidative stress by bisphenol A and its pleiotropic effects

or low dose TNFa

MiR-29c Inhibits TNF-α-Induced ROS Production and Apoptosis in Mouse Hippocampal HT22 Cell Line

I haven't read any of the above papers. The titles/abstracts tells you how essential ROS are for the the actions of these known obesogens.

My view: compounds generating ROS "equivalent" to 0.3-1.0mM of exogenously applied H2O2 will mimic insulin, continuously, and promote adipogensis without exposure to insulin or to food intake. The "uncontrolled" loss of calories in to adipocytes will make you hungry. You could include very low dose (<1μM) 4-HNE with these.

Between 1.0 and 5.0mM "equivalents" of H2O2 exposure will generate insulin resistance. This will limit fat gain at the cost of hyperglycaemia and/or hyperinsulinaemia.

With H2O2 at as low as around 5mM then all function as an insulin replacement is lost and we are getting beyond insulin resistance and in to cell dysfunction, ie the region of ROS -> apoptosis, given enough ATP or ROS -> necrosis with inadequate ATP for apoptosis. And all shades of grey between the two. Very high H2O2 is lethal.

Neutrophils do not throw H2O2 (and superoxide) at invading pathogens to make them grow and/or reproduce. ROS from a respiratory burst are at usefully lethal levels.

These features of the ROS signalling system are quite distinct from the action of linoleic acid and metformin, which tweak the ROS system in their own distinctive ways. But under everything is the ROS system.

I may have mentioned that before.

Okay, hopefully back to metformin soon.

Peter

Saturday, April 01, 2023

Metformin (14) Normals

One of the flakiest aspects of Protons is the concept that the glycerophosphate shuttle transforms cytoplasmic NADH in to a mitochondrial FADH2 input, altering the FADH2:NADH ratio in a direction which favours reverse electron transport through complex I, given a reduced CoQ couple, and this leads to a) continued ROS generation to maintain insulin signalling and b) easy achievement of high ROS once a cell is replete with calories, ie when it is then necessary to resist further insulin mediated calorie ingress.

So the glycerophosphate shuttle should mediate both insulin signalling and insulin resistance, essentially controlled by the redox state of the CoQ couple. If CoQH2:CoQ is moderate ROS are still adequate to activate insulin signalling, if CoQH2:CoQ ratio is high ROS will also be high and insulin signalling will be curtailed.

Metformin blunts insulin signalling, in addition to reducing hepatic glucose output, by blockade of the glycerophosphate shuttle at mtG3Pdh.

Finding evidence to confirm this bias is not easy. I hope we all recall the poor Polish girl with SHORT syndrome who fell in to the hands of the endocrinologists who "treated" her insulin "resistance" with metformin. That ended well...

Metformin (11) a SHORT paradox

However, I tripped over this next paper while looking for something else. Oddly enough when I saved it it turned out I had already got a copy and had put up a one liner post about it

Metformin (12) You don't need to be SHORT

but didn't explain its significance. Here's the paper:

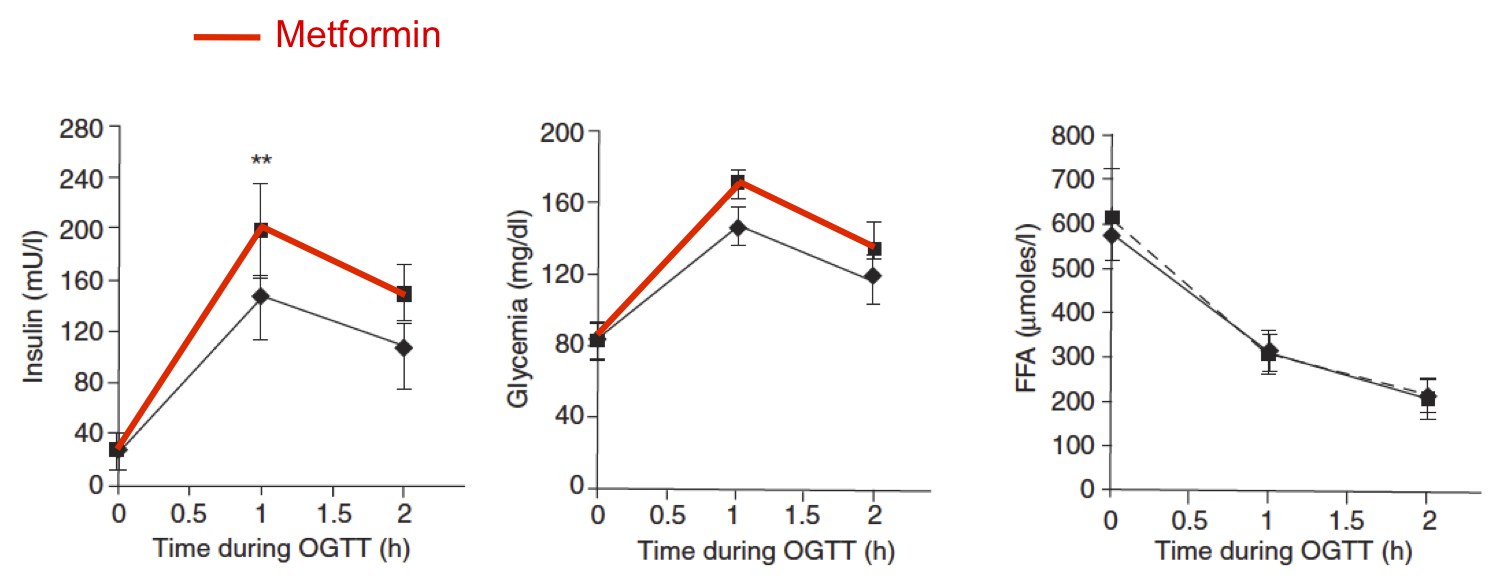
and here we go as to why I like it.

These are the results of treating either DMT2 people or people with a family history of DMT2 using metformin. There is an almost infinite supply of such responses in Pubmed, metformin is clearly insulin sensitising. If you wanted to you could say that metformin reduces insulin resistance. And then blanche at the thought of trying to define exactly what you mean by "insulin resistance".


I guess the first small fly in the ointment is the fasting FFAs,  as I've highlighted here


It looks like the rise in FFAs was not statistically significant but it must have come damned close. Increased insulin sensitivity should suppress FFAs.

So if we consider the insulin and glucose responses to be a direct result of suppressed gluconeogenesis in the liver and subsequent decreased hepatic glucose output then the rise in FFAs becomes as simple as being a direct consequence of metformin decreasing insulin signalling in adipocytes via blockade of mtG3Pdh plus a decreased absolute level insulin per se due to reduced hepatic glucose output. From my point of view all the adipocytes "see" is less  absolute insulin plus less ROS generated via the glycerophosphate shuttle, so less insulin signalling. They release FFAs.

If we then look at an obese person who is still insulin sensitive they have no fasting hyperglycaemia and no fasting hyperinsulinaemia.


Giving metformin for 10 days has essentially no effect on fasting insulin or glucose. Gluconeogenesis will still be reduced by metformin but the accompanying blunting of hepatic insulin signalling (via blockade of mtG3Pdh) allows more glucose release, so the two roughly balance out. This may not be the case under peak metformin effect, diabetic rats do drop their blood glucose on an IV dose of metformin at a therapeutic level of hepatic glucose output suppression. This may well be dependent of how much metformin you give, by which route and at which time you measure. Fed vs fasted would matter as well.

On feeding 75g of glucose to normal people for an OGTT insulin signalling becomes important and the decreased insulin signalling intrinsic to metformin shows as mildly impaired glucose tolerance (statistically ns but clinically 130mg/dl vs 170mg/dl might be undesirable) but because of blunted insulin signalling a significant compensatory hyperinsulinaemia is needed to get even this rather impaired glucose response.

So. In insulin sensitive people metformin's easily comprehensible action to obtund insulin signalling shows, under high glucose and high insulin conditions, as an impaired glucose tolerance with compensatory hyperinsulinaemia.

With supra-maximal dietary glucose (the specific intention in an OGTT is maximal activation of the insulin system) suppression of hepatic glucose output becomes irrelevant and all we see is mtG3Pdh inhibition manifest as poor insulin signalling. As it did for the poor girl with SHORT syndrome.

Nice.

I'm now wondering if there is any logical way of working out why people with DMT2 almost always (and clearly unexpectedly) benefit from metformin, while people with simple obesity behave exactly as you would expect them to do under an insulin signal blunting agent, especially during an OGTT.

It might be possible. I'm thinking about it.

Peter