Tuesday, October 17, 2023

Insulin mimesis without NOX enzymes (6) MCT versus linoleic acid

I have a preference for median lifespan when thinking about the potential effect of an intervention on a population because it is looking at the population as a whole, rather than a few (quirky?) isolated individuals who make up the maximum longevity crowd. Or should I say the maximum longevity chosen few? I guess it confirms my biases too. Which I like.

Let's recap the Jim Johnson's lab findings about the Surwit diet effects described here.


I have removed the lowest insulin gene group data and just included those with a normal insulin phenotype. A number metabolic snapshots were taken at around the 80 weeks of age mark. Surwit fed animals were heavier on the scales and fatter by DEXA compared to chow fed:


No one should be surprised that they were also hyperglycaemic and hyperinsulinaemic, ie insulin resistant:
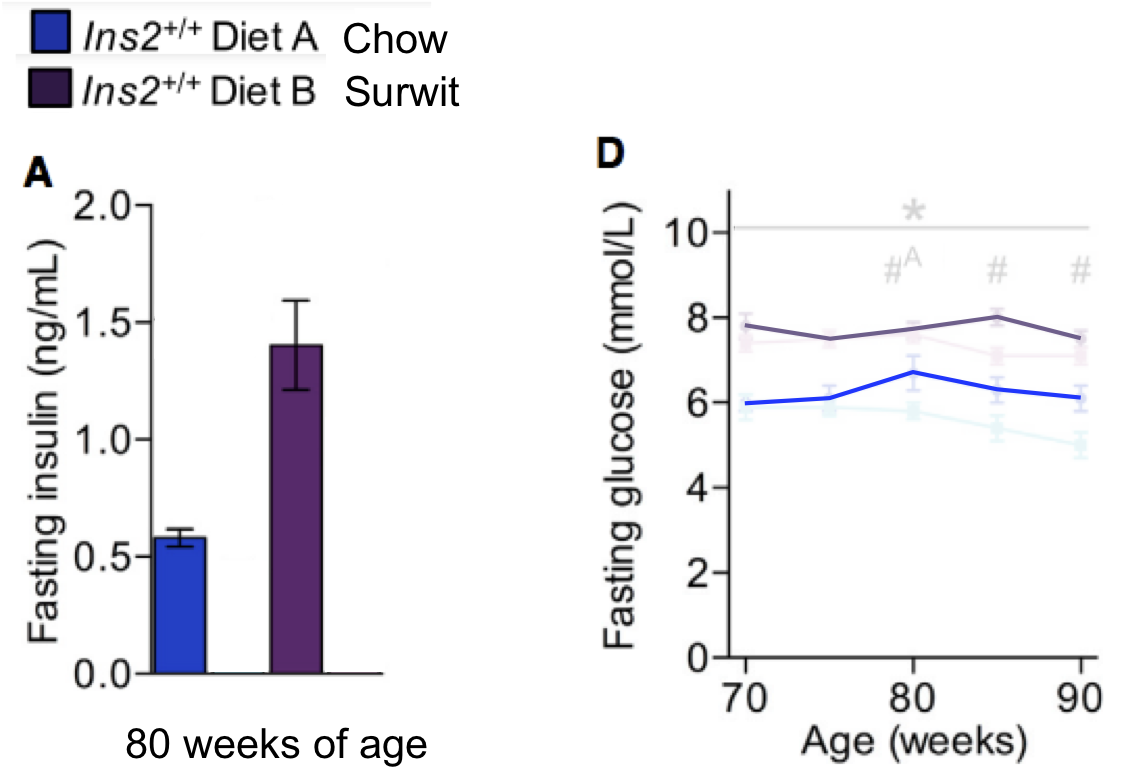


What should be extremely surprising is that these Surwit fed mice while being obese, hyperinsulinaemic, hyperglycaemic and insulin resistant, lived over 100 days longer than their slim chow fed relatives. The data are in here:


which I can simplify down with some very crude curve fitting by eye in Powerpoint to give this:


Interesting.

Now let's look at some rats fed an obesogenic diet based on lard. There are some good data in here although it does not give us the linoleic acid content of the lard:

An isocaloric moderately high-fat diet extends lifespan in male rats and Drosophila

Oh, and their data presentation is not great.

Here we have the weights. Colour scheme is different to the first study


You can't tell if the weight loss toward the end was from the surviving rats eating less or that the fattest rats died earliest. Probably a bit of both. But the lard fed rats were fat.

They were hyperinsulinamic


and they were hyperglycamic.


and obviously they too were insulin resistant.

But this time the longevity curves are reversed and the fat rats die younger than the slim control fed rats, by about 100 days:


So we have the mice in Jim Johnson's lab and the rats in the lab in Harbin, China. Both have comparable levels of obesity and insulin resistance. Both are oxidising FFAs when insulin should be suppressing FFA availability in peripheral tissues. In both cases excess energy is being supplied from fatty acids so there is an absolutely normal physiological reduction/rejection of some of the calories which are being taken up by cells using insulin facilitation.

This normal physiological response is mediated by reverse electron transfer through complex I acting to inhibit insulin signalling at the insulin receptor/substrate level.

In animals made obese using fully hydrogenated coconut oil in a Surwit diet the mitochondria are normal and mitochondrial/cytoplasmic membranes lipids are low in linoleic acid as you would expect from 1-2% LA in the diet. So high-physiological ROS from oxidising fatty acids will inhibit the insulin cascade, as they must, but in the process will only encounter "physiological" levels of linoleic acid and only generate "physiological" levels of 4-HNE, 13-HODE, 9-HODE  etc. These lipoxides, like superoxide, are normal signalling molecules. A low level of generation is normal and generally beneficial. Probably essential.

Generating ROS via RET in the ETC is pro-survival and pro-longevity. See here, discussion on another day.

The obesity induced by increased dietary linoleic acid is different. Here the adipocytes are large because they fail to limit their insulin cascade adequately. Under these conditions adipose tissues will store an excess of lipid from all sources without insulin being elevated, indeed in the earliest stages insulin signalling will have been enhanced and IR subnormal. The core initiating problem being that linoleic acid is present in levels which generate too small an ROS signal, so fail to limit caloric ingress and storage. Also there is good evidence that linoleic acid is preferentially oxidiseg compared to saturated fats.

However excess basal lipolysis secondary to adipocyte size will release all species of FFAs, arguably with some favourites, the problem now is that adipocytes *ignore* insulin. It doesn't matter how insulin sensitised you might have been via LA in order to become obese. If basal lipolysis is up, it's up. And insulin no longer matters. The exact mix of FFAs delivered to the periphery (especially muscle) becomes less important. All cells oxidising any type of fat generate more ROS than cells oxidising glucose.

One of the secondary problems with high linoleic acid diets is that, separate from their obesogenic effects in mitochondria, the LA molecules are also present at increased levels in tissue lipids.

The problems really present when ROS are being generated on a background of an intake of (in this human observational study) of 17% of calories as linoleic acid. Apart from making you obese this provides an environment where ROS which *should* meet a "normal" level of LA (ie derived from 2% in the diet) are actually encountering an environment derived from 17% LA in the diet. Generating *physiological* levels of 4-HNE etc is out of the question when all the ROS can "see" is freely available double bonds to interact with. Lipids are converted to lipoxides in supraphysiological quantities, cellular damage ensues and this chain of redox damage manifests as what we describe as pathology.

That's what I think is happening.

I think I've said enough for one post. I'll have to write a separate post about RET and Superfly,


the fly featured in the paper nominated for the best graphical abstract of all time, ever. By me anyway.

And about ROS and mitochondrial biogenesis.

Peter

Sunday, October 15, 2023

Insulin mimesis without NOX enzymes (5) MCT plus linoleic acid

You can become obese by having your adipocytes fail to limit insulin signalling. That is what linoleic acid plus an insulogenic diet does, pure Protons.

You can also become obese by making your liver alone insulin resistant in combination with an insulogenic diet. The Surwit diet approach.

These concepts put us in to a position where we can examine this study, HT to Tucker:

Ability of high fat diet to induce liver pathology correlates with the level of linoleic acid and Vitamin E in the diet

In particular we can look at these curves:


Obviously blue circles are the chow and red triangles show the 8% linoleic acid, high overall fat diet. The latter is as obesogenic as you might expect. The surprising curve is the beige 1% LA line. This diet is clearly less obesogenic than the high LA diet but is not exactly slimming when compared to the chow line. And it supplies only 1% of calories from LA.

So do *all* high fat diets make you (and rodents) obese?

The macro of the diets are described in Table 1. I've cut off the vitamin E parts as they are a different subject altogether and might be worth a post some day.


If you come at this from the point of view that saturated fats are slimming and LA is obesogenic then the low LA diet causing a significant level of obesity is a paradox.

In the legend to Table 1 there is a link to supplementary information which I followed, trying to find whether fructose was included in the diets (the paper doesn't actually say) but I did find out that the bulk of the fat in both the 35% fat diets is, as you may have guessed, fully hydrogenated coconut oil.

The 1% low LA diet is a classical Surwit derivative (possibly without the sucrose, I don't think it matters) and is inducing hepatic insulin resistance via ETC derived high levels of ROS to allow penetration of glucose/insulin to peripheral sites. The adipocytes see too much insulin for too much time and get fat.

The 8% high LA diet has exactly the same problem from its MCT components as the 1% LA diet but this time it's compounded by peripheral adipocyte exposure to high levels of LA causing pathological insulin sensitivity, delivered directly via chylomicrons from the gut, bypassing the liver. They get high insulin exposure secondary to MCTs acting in the liver to allow increased glucose/insulin to the systemic circulation PLUS a pathological inability to resist insulin's fattening signal in the periphery via LA, ie adipocyte Protons effect on top of localised hepatic insulin resistance. Double wammy, double weight gain.

Peter

Saturday, October 14, 2023

Insulin mimesis without NOX enzymes (4) MCT

Before I get to talk about this (highly recommended) paper:


which came up in a discussion between Tucker and Brad a few months ago, I have to clarify as well as I can how fully hydrogenated coconut oil, one of the most saturated fat sources on the planet, is obesogenic, even under low linoleic acid conditions. The post is already part written but I want to get the MCT mechanism down here as clearly as possible using one of my long term doodles.

Apologies if it's getting repetitive, this is really an executive summary. Here we go.

One basic concept of the Protons hypothesis is that saturated fats shut down insulin signalling when fatty acids are freely available and glucose is scarce. Classically this is under fasting conditions where allowing glucose in to muscles etc would rapidly deplete the body of glucose stores which are helpful to maintain brain function under fasting conditions. It applies whole-body. Like this:


Under high fatty acid availability the ROS derived from reverse electron transfer through complex I of the mitochondrial electron transport chain inhibit insulin signalling at the insulin receptor/receptor substrate level, ie at the cell surface. Simple and obviously adaptive. This is also the system which fails when linoleic acid in bulk is introduced to the diet.

The next concept is that metabolic substrates which do not cause insulin secretion from beta cells will generate their own insulin-mimicking ROS signal using NADPH oxidases, also at the cell surface of nutrient recipient cells. At low levels these ROS inhibit the "insulin signalling suppression system" and allow the insulin signalling to take off, in the absence of insulin per se:


Mostly this happens in the liver because that's where most of the fructose/ethanol/acetate ends up. High doses are a separate story.

Aside: An high concentration of these substrates, ie two cans of cola giving >17mmol/l fructose in the systemic circulation or doing ethanol shots, will generate severe inhibition of the insulin cascade at the insulin receptor/insulin receptor substrate level whole-body, via NOX hyperactivation. And cellular damage from ROS spilling everywhere will result, ie Badness. Back to low level discussions. End aside.

The situation with MCTs is different from both of the above. They too are delivered primarily to the liver, not to the systemic circulation, and taken up rapidly by the mitochondria. All undergo beta oxidation to acetyl-CoA but only some of this acetyl-CoA will enter the Krebs cycle to provide FADH2 and NADH to the electron transport chain. The rest will be diverted to ketone bodies without providing any input to the ETC, and so without generating the inhibitory ROS you would expect from a saturated fat. I consider this is what happens, almost only in hepatocytes:


Low levels of MCTs (in this doodle I've suggested 50micromol/l, this is just for a thought experiment, not data based) arrive at the liver and have absolutely nothing to do with NADPH oxidase enzymes while generating low levels of ROS via mitochondria. These "low" levels are high enough to disable the "insulin signalling inhibitory system" and allow the insulin cascade to be activated but not high enough to directly inhibit the insulin receptor/substrate complex. This activation is insulin "mimesis" without substrate going anywhere near NOXs 1,2, 4 etc. But only in hepatocytes because that's where MCTs are diverted to.

The result is to sequester glucose in to hepatocytes so reduce penetration of glucose past the liver and in to the systemic circulation. The pancreas sees reduced glucose, so secretes less insulin. Lipolysis increases, you might lose weight.

Under Surwit-like diet conditions with coconut oil at 35-60% of calories things are different. Here large amounts of MCTs are delivered to the liver, I've suggested 600micromol/l but who knows what the portal vein concentrations really are? These MCTs still "waste" acetyl-CoA to produce ketones but the increased bulk supply means more acetyl-CoA can enter the Krebs cycle/ETC. Enough to generate ROS at levels which will inhibit activation of the insulin cascade at the insulin receptor/substrate level:


Under conditions of suppressed hepatocyte insulin signalling dietary derived glucose will penetrate past the liver and in to the systemic circulation. This will require the pancreas to crank out more insulin. And so inhibit lipolysis. As in the obesogenic Surwit diet.

That is all for now.

Peter

Thursday, October 12, 2023

Insulin mimesis and NOX enzymes (3) MCT

So now it's time to see how it is possible to understand the obesogenic effects of fully hydrogenated coconut oil in Surwit diets and also the recognised potential for MCT induced weight loss effects. Oooh, another paradox!

I've been skirting around this subject for years and I still do not have nice solid answers but this is getting closer.

It's worth thinking, initially, about fructose as a weight loss agent.

Inclusion of low amounts of fructose with an intraduodenal glucose load markedly reduces postprandial hyperglycemia and hyperinsulinemia in the conscious dog

Going back to this canine model of intraduodenal glucose infusion +/- 5% fructose we have these curves:


The fructose supplemented line (open circles) shows a markedly reduced insulin excursion, a direct result of the reduced penetration of glucose past the liver. Fructose, acting solely at the liver, is imitating insulin via ROS from an NADPH oxidase. Glucose gets stored:


The pancreas sees a markedly reduced glucose level, so responds with a markedly reduced insulin secretion (200pmol/l down to 100pmol/l).

If you were an adipocyte in the periphery you are not going to see the fructose acting as insulin via ROS to sequester glucose as hepatic glycogen. This all happens in the liver. All an adipocyte sees is 100pmol/l of insulin instead of 200pmol/l.

What is that going to do to your rate of lipolysis?

I would expect it to be higher in the fructose supplemented state.

Aside. There is s small rise in lactate with the fructose infusion but I doubt it would offset an halving of the insulin level. End aside.

Does this cause weight loss? I don't know that anyone has asked that question in this form for humans using fructose. 

Acetate, which I consider to induce a similar signalling response to fructose, certainly does. Drinking vinegar for weight loss appears to work. The effect is not huge but appears real and is mechanistically logical:

Vinegar intake reduces body weight, body fat mass, and serum triglyceride levels in obese Japanese subjects

So maybe fructose is a weight loss drug, in modest amounts, on a background of a starch/linoleic acid diet.

So if we get back to medium chain triglycerides for weight loss, here they used either coconut oil or MCT oil (both worked):
You can get a marked decrease of weight gain in a (mouse) model of lard-driven obesity by small amounts of MCTs.

Like fructose and to some extent acetate, low doses of MCTs are predominantly diverted directly to the liver via the portal vein from the gut. If they generate modest doses of ROS, ie at insulin mimetic levels, in the liver alone, they will allow the diversion of glucose in to hepatic storage and so reduce penetration of glucose to the systemic circulation and that will reduce the need for insulin secretion. Peripheral adipocytes will see less insulin and so store less, or release more, fatty acids.

To me that makes sense. Increasing hepatic insulin-like signalling derived from very modest MCT ROS generation protects the peripheral adipocytes from glucose/insulin exposure.

Exposure to higher levels of MCTs, ie Surwit-like diets, is undoubtedly obesogenic.

As we increase the proportion of MCTs in the diet this gut-to-liver channel increases delivery giving increased storage of glucose as hepatic glycogen (no problem) and an attempt at hepatic storage of MCT fatty acids. But MCTs aren't stored, they are rapidly oxidised to give ketones plus mitochondrially derived ROS. At high enough exposure there will be enough ROS to finally resist insulin signalling within the hepatocytes.

Hepatic insulin resistance allows more insulin to penetrate past the liver to the systemic circulation and so to reach peripheral adipocytes. It's not essential for MCTs per se to reach those adipocytes in any quantity, though if they do so at insulin mimetic levels they will compound the problem.

Back in March this year I pointed out how mixed coconut MCTs at "physiological" concentration are experimentally confirmed generators of ROS at a level which will phosphorylate Akt in isolated neurons, insulin mimesis. I was also clear that "supra-physiological" exposure to octanoate inhibited correct development of adipocytes, ie caused insulin resistance. These effects applied to hepatocytes, which are the primary target of dietary MCTs, would be quite enough to explain the Surwit effects and weight loss effects, depending on dose.

Summary: Low dose MCTs are insulin-mimetic and primarily delivered to the liver only. They protect peripheral adipocytes from insulin exposure and allow weight loss/limit weight gain.

High dose MCTs provide insulin resistance levels of ROS in hepatocytes and facilitate insulin's penetration to peripheral adipocytes. Any low levels of MCTs reaching peripheral adipocytes will provide low levels of ROS to augment fat storage by insulin per se.

It is perfectly possible to generate obesity with highly saturated MCT based diets. Even at 2% linoleic acid.

Peter

Wednesday, October 11, 2023

Insulin mimesis and NOX enzymes (2) Lactate

I wasn't going to torture lactate in the usual manner but Alan Couzens on Twitter suggested the two essentials for weight loss were to oxidise lipids and to minimise lactate. I was vaguely aware that lactate is a potent inhibitor of lipolysis and that rapidly rising lactate with exercise is going to tank your fatty acid availability. So I assumed lactate is an insulin mimetic and this is a quick hit searching Pubmed for lactate and lipolysis. GPR81 and HCAR1 are different names for the same receptor:

Lactate inhibits lipolysis in fat cells through activation of an orphan G-protein-coupled receptor, GPR81

which obviously suggests that this might be happening:


However there was nothing here to relate this to NADPH oxidases, so I added some more search terms and got this paper:


which is more interesting.

Recall that acetate primes NOX4 in neutrophils to be ready to protect you from severe sepsis? By phosphorylating it.

Lactate does something similar and allows me to add this part to the doodle:


This, in chondrocytes, is a positive feedback loop. When they want to to reject insulin signalling, they really will generate toxic levels of ROS, which will ruin your knees. I wonder if this positive feedback is a generic trait too. Okay, I'll leave lactate alone soon.

Interestingly, in people undergoing total knee replacement surgery serum lactate can be as high as 13mmol/l at rest. Even in "normal" controls one individual had a lactate of 9mmol/l at rest. One feature of metabolic syndrome seems to be that you walk around with the lactate levels of a young athlete under exercise while sitting still, even without a cup of sugary tea by your hand...

Fascinating.

Peter

Tuesday, October 10, 2023

Insulin mimesis and NOX enzymes (1) A principle

This one of my most scribbled upon diagrams. It's how insulin works:


This is the signal, without insulin, generated by mild hyperglycaemia:


and this is the signal generated by "physiological" fructose exposure


You can do exactly the same doodle with ethanol. This paper summarises the low and high dose exposure to ethanol:

Biphasic effects of chronic ethanol exposure on insulin-stimulated glucose uptake in primary cultured rat skeletal muscle cells: role of the Akt pathway and GLUT4

and I hope no one is surprised that it is NOX mediated:

Acute ethanol intake induces superoxide anion generation and mitogen-activated protein kinase phosphorylation in rat aorta: a role for angiotensin type 1 receptor

"Ethanol induced systemic and vascular oxidative stress, evidenced by increased ... NAD(P)H oxidase-mediated vascular generation of superoxide anion... "

I also hope I can be forgiven for suggesting that this is the situation. There may be more than one receptor involved so just look at the general picture


The general principle which drops out of all of this is that low concentrations of substrates which enter cells without requiring insulin signalling are set up to provide their own insulin signal, largely through the NADPH oxidases. Low levels of glucose, fructose and ethanol are all insulin mimetics by virtue of their activation of assorted NADPH oxidases to generate an insulin-like ROS signal which eventually activates Akt signalling downstream. They give the impression of being insulin "sensitisers". Really they are mild insulin mimetics.

If pushed to extremes any of these substrates will generate enough ROS to resist insulin signalling. If more ethanol is entering a cell than it needs for metabolic requirements, and that ethanol ingress cannot be "turned off", then the body simply shuts down insulin signalling by the correct amount to compensate and so maintains metabolic stability.

If the system is so overloaded that simply resisting insulin is not enough to normalise caloric ingress then it will generate markedly elevated ROS both from NOX sources and from excess mitochondrial delta psi sources and so ROS mediated damage ensues. This is Badness. 

Addding 5% fructose to an intra duodenal glucose infusion decreases systemic glycaemia and systemic insulinaemia, feeding 70% of calories as fructose doesn't, neither does putting it in the drinking water when fructose makes rodents thirsty yet all they have access to is fructose-water.

Low dose ("physiological") exposure is no problem. High dose is.

All of this leads to acetate.

Acetate enters cells without the assistance of insulin. Sooooo....

Would you expect low doses of acetate to inhibit lipolysis by mimicking insulin? If it is likely to generate its own insulino-mimetic ROS signal? And if it does, would you then expect supra "physiological" exposure to reliably inhibit insulin signalling?


and the the fact that high concentration of acetate enhance lipolysis is a paradox. Of course if you alter the pathway to this one:


then the paradox disappears and you have another logical piece of understanding where excess acetate gives excess ROS and blocks the insulin like effect, leading to increased lipolysis.

But is it true? As far as I have read low levels of acetate are well recognised as insulin sensitising but no one is looking at NOX and ROS.

However this paper suggests I might be on the correct track:

Acetate sensing by GPR43 alarms neutrophils and protects from severe sepsis

How might acetate save your life in sepsis?

"Indeed, GPR43 activation by acetate triggered p47phox S345 phosphorylation [of NADPH oxidase] (Fig. 1d, Supplementary Fig. 1d), thereby confirming that GPR43 activation primes neutrophils."

In my mind I couple the two papers together and I like the inference.

Ketone bodies?

High dose plus hyperglycaemia (aka diabetic ketoacidosis) and NOX4:


Ketones inhibit lipolysis, GRP43 activates NOX, probably NOX4:

"...lipid profile amelioration by KDs could be ascribed to the actions of acetoacetate via GPR43 and of β-OHB via GPR109A on lipolysis..." ie they shut it down.

My world view says that ketone bodies at low concentrations are ROS generators using a signal through a G protein from GRP43 to activate an NADPH oxidase to imitate insulin's ROS activating signal. High levels of ROS do the opposite.

It's a general principle. You know the doodle by now.

Life makes sense.

Peter

Friday, September 29, 2023

Insulin sensitivity makes you fat. Insulin resistance makes you fat. Discuss. (04) M scores

This is a study which Raphi threw out on Twitter several weeks ago. It can take me personally this long to understand some studies. It's interesting as it clearly shows that weight loss over 12 weeks causes a deterioration in insulin sensitivity in some people: 

Changes in adipose tissue lipolysis gene expression and insulin sensitivity after weight loss

They started with 52 obese people and ended up with 38 who completed this part of the study. On average insulin resistance dropped with weight loss.

On average, that is. It did for some. For others it didn't. Yes, in nine of the group of 38 subjects, insulin sensitivity deteriorated with weight loss. As the authors comment:

"Thus, it may seem paradoxical that some of the changes observed in the present study during weight loss prevented an increase in insulin sensitivity."

I love a paradox.

What is going on?

Here are the metrics from Table 2


The paradox comes from the M values.

These are the clamp values. Insulin was infused to maintain a plasma level of 80microIU/ml and hypoglycaemia was avoided by infusing glucose to maintain a plasma level of 5mmol/l. If you do this for 2h you can assume some sort of steady state is achieved and the M value is the rate of infusion of glucose needed to counteract insulin's hypoglycaemic effect over the final 40 minutes of the clamp. The higher the M value the better insulin is working and the less insulin resistant your subject is. This is the gold standard, HOMA-IR is the poor relative (though much easier to estimate and wouldn't have shown any paradox in this study).

So in nine subjects the M value deteriorated with weight loss.


The subjects were divided on the basis of the direction of this change in M score resulting from weight loss.

To cut a long story short the group which deteriorated their M score were obese but had normal insulin sensitivity before weight loss. The so-called metabolically healthy obese. The subjects whose M score actually improved were insulin resistant before weight loss.

From a previous paper by the same group the M score in a group of lean control subjects (not described here but part of the overall study) was 9.77mg/kg ffm/min and here, for the obese but insulin sensitive group M, it was 9.17mg/kg ffm/min, ie no difference. In the obese but insulin resistant subjects pre weight loss M values averaged 5.63mg/kg ffm/min, ie low, p<0.05.

The first question is: why should metabolically healthy, insulin sensitive obese people deteriorate their insulin sensitivity score as a result of weight loss?

That's the simple one. They're losing weight and have not stopped at the time of the hyperinsulinaemic clamp. Their diet is providing completely inadequate calories to maintain stable weight so they are losing some weight, mostly from fat. The process of weight loss involves releasing FFAs from adipocytes with an associated rise in plasma FFAs and subsequent oxidation of those FFAs. I did a ball park rough calculation and someone of my height (but obese) would have been on 1400kcal per day, ie they would be hungry and oxidising body fat to make it up to the well over over 2000kcal I'm considered to require to run my metabolism.

Aside: Obviously from the Protons perspective oxidising fatty acids will generate ROS irrespective of mitochondrial delta psi and the cell will resist insulin's signal in proportion to this fatty acid oxidation induced ROS signal. It is apparent that this cannot be suppressed by an hyperinsulinaemic clamp for two hours, see below. End aside.

There is a study which actually measured fat oxidation under an hyperinsulinaemic clamp under conditions of active weight loss. It's this one:

Prolonged Fasting Identifies Skeletal Muscle Mitochondrial Dysfunction as Consequence Rather Than Cause of Human Insulin Resistance

which combines a Dutch version of the M score with indirect calorimetry during the steady state conditions of the clamp. Neat hey? This time weight loss was not from an hypocaloric diet, it was from a zero caloric diet, ie extended fasting, which sources calories from a minimal carbohydrate, minimal protein, very high fat source, ie the subject's own body catabolism. Just for 60 hours. But by the end nearly 100% of calories from are fat oxidation.

The clamp data come from Fig 2, the rates of disposal of glucose in red come from Table 2 and I've clarified the labels to point out that "Fed" means "Overnight fasted", not post prandial:


The glucose disposal units don't include fat free mass as this doesn't noticeably change in 60 hours of fasting so this means the values can't be directly compared to M values. We can see that glucose disposal halves under hyperinsulinaemic clamp study conditions when 60 hours of fasting necessitates metabolism to be run on fatty acids.

Proof that fatty acid oxidation continues under hyperinsulinamia comes from measurements in a respiratory chamber while the clamp was on-going. From the bottom of Table 2:


After an overnight fast, on a balanced diet, lipid oxidation is 1.2μmol/kg/min and drops to 0.3μmol/kg/min under clamp. During body fat loss for 60 hours the clamp can only suppress lipid oxidation to 1.52μmol/kg/min, ie still higher than under basal conditions before the 60 hour fast. Oxidising lipids intrinsically generates mitochondrial ROS to limit ingress of excess calories by limiting insulin facilitated signalling. Even at clamp levels of insulin exposure.

So weight loss causes insulin resistance because it intrinsically involves fatty acid oxidation. Stopping the weight loss using a period of adequate feeding would allow the weight loss induced insulin resistance to fade away. The only "paradox" is that the changes which occur in the provision and oxidation of fatty acids cannot be immediately reversed by the external application of 80μIU/ml of insulin, at least not within two or three hours.

It's also worth mentioning that this insulin resistance during weight loss is utterly normal and pro-survival from an evolutionary perspective.

Okay. Much more interesting are the patients who do improve their insulin sensitivity with weight loss. Fasting FFAs before weight loss are around 0.71mmol/l, higher than the value of 0.52mmol/l found in the slim control group in the previous section of the study.

This group has metabolic syndrome, ie they do not have the ability to suppress lipolysis using insulin because enough of their adipocytes are "leaking" FFAs via basal lipolysis and so are exposing their peripheral tissues to an on-going supply of FFAs, which are being oxidised continuously whether insulin is present or not. When insulin is present then this unstoppable supply of FFAs necessitates enough resistance to insulin's signal to balance caloric ingress. Glucose disposal under hyperinsulinaemic clamp (M value) stays low at 5.63mg/kg ffm/min because fatty acids are being oxidised, so glucose is significantly excluded. We don't know the FFA concentration under clamp or fatty acid oxidation in this study but my view is this is what is happening.

With weight loss adipocytes shrink. Two things happen. FFA levels rise because weight loss requires fat release. And, as adipocytes shrink, they decrease their size-determined basal lipolysis rate and so restore insulin's ability to suppress FFA release. These opposing factors, in this case, balance out in a trivially raised level of fasting FFAs to 0.76mmol/l, but the release of these FFAs can be suppressed by insulin, so M rises from 5.63mg/kg ffm/min to a respectable 8.55mg/kg ffm/min under the hyperinsulinaemic clamp after weight loss.

Fat oxidation obligates a degree of resistance to insulin's signal to maintain physiological caloric ingress. Protons also suggests some fatty acids do this better than others.

I was going to stop here but I may as well throw this in. People may recall this graph:


Now we can get rid of most of the labelling and insert the concepts discussed in this post. These arrows represent what I consider the situation to be under weight stability, so the situation is not complicated by the level of insulin resistance superimposed by weight loss.


It's easiest to think of the arrows representing the study subjects before 12 weeks on a severely hypocaloric diet. During weight loss the metabolically healthy group will temporarily move their location to the right due to increased fatty acid oxidation resisting insulin. Those with metabolic syndrome will try to do the same but this is offset by shrinking adipocytes decreasing their basal lipolysis so allowing insulin to work and actually improve the M score overall.

I could have stopped here too but I still have a final arrow to add. This comes from Arne Astrup's lab in Denmark. There are no clamp data but under weight stability the M score and HOMA-IR would correlate perfectly well, assuming everyone was on a similar mixed diet. Astrup looked at formerly obese (FO) women who had maintained, through sheer willpower, a normal body weight using conventional dieting. Rare as hen's teeth, but they do exist.

Fat metabolism in formerly obese women

No clamp data but just look at the insulin and glucose values. C is control, FO is formerly obese. Formerly obese ladies are very, very insulin sensitive. Pathologically so:


If we wanted to add these ladies to the graph they would be here, at the blue arrow:


There is a body of opinion on t'internet that holds that insulin resistance causes obesity. They have some explaining to do.

Now I really will call it a day.

Peter

Monday, July 10, 2023

Insulin sensitivity makes you fat. Insulin resistance makes you fat. Discuss. (03) Visceral vs subcutaneous

Visceral adipocytes are exquisitely insulin sensitive. Visceral adipocytes are insulin resistant. Let's go.

This is another of the anchor studies which has informed my world view over the last decade or so:

Insulin signaling in human visceral and subcutaneous adipose tissue in vivo

I like it because it used real live intact human beings, it used a physiological dose of insulin and it looked at the signalling pathways within cells. It then compared the effects within visceral adipocytes (omental in this case) with those in subcutaneous adipocytes. I'm not sure that I had much of an opinion about this before I read the study but it locked me in to my still current opinion that visceral adipocytes are particularly insulin sensitive.

This has been reinforced by the PET scan data from this next study. The mouse section is poor as it compares SC adipose tissue to epididymal adipose, the effect would be more marked if they had used omental/mesenteric as the visceral adipose source but hey, the PET data in real live humans are nice...

Increased glucose uptake in visceral versus subcutaneous adipose tissue revealed by PET imaging

This property of visceral adipocytes appears to be intrinsic to their stem cells. If you differentiate stem cells from SC and visceral tissues in to adipocytes those adipocytes, generated in-vitro, retain this exquisite insulin sensitivity.

Fat depot-related differences in gene expression, adiponectin secretion, and insulin action and signalling in human adipocytes differentiated in vitro from precursor stromal cells

So visceral adipocytes are the most insulin sensitive in the body and this is programmed in to their stem cells, which makes me accept that it is evolutionarily conserved and so essential their function. Which, surprisingly, is neither to kill us nor give us metabolic syndrome.

But we also have this:


All of the below quotes are taken from the same screenshot.


This was 2010. I doubt that there is any less confusion nowadays.

"Adipocytes from VAT are more insulin-resistant than SCAT adipocytes (39,40)."

"Visceral adipose tissue has higher rate of insulin-stimulated glucose uptake compared with SCAT adipocytes."

"Visceral adipocytes are more metabolically active and have a greater lipolytic activity than SCAT adipocytes (44,45)."


which gave me this image:


The lines represent paired adipose samples, a control sample labelled "Basal" (open circles) and a sample to which a fixed concentration of noradrenaline (NA) had been added at all insulin exposures.

The first red flag is that basal lipolysis can be suppressed by insulin. So what this paper means by basal lipolysis and what other papers mean by basal lipolysis appear to be quite different. The other really strange finding is that under noradrenaline induced lipolysis insulin is suppressive (as you would expect) up to 250μU/ml at which point insulin enhances lipolysis, markedly. Hmmmmmm. I would suggest insulin induced insulin resistance but that seems like a long shot. Ultimately the model doesn't seem to be a very good one.

The only difference I can see between this group's model and the rest of the world is that they use tiny cubes of adipose tissue rather than isolated adipocytes. If I had to guess I would suggest that there are the end terminals of noradrenergic neurons present in their adipose samples and these are modifying the response to insulin and noradrenalin. It could also be that having structure around adipocytes might alter their behaviour ie this might be a better model than isolated adipocytes. Hard to compare when almost all of the surrounding work is done with isolated adipocytes. Generally I would be very cautious about looking for understanding in such a model as the results are counterintuitive, but I could be wrong. That's a few days of my free time I'll never get back! Next I checked the other three refs.


Ref 45

Metabolic complications of visceral obesity: contribution to the etiology of life of type 2 diabetes and implications for prevention and treatment.

is a review and not available on Pubmed or Sci-Hub and I doubt it it's worth chasing.

Ref 39:


does not, as far as I can make out, in any way support the statement it is purported to. The study wasn't designed to do so and I can only hope it was a typo when it was cited.

Ref 40 is gold dust


because it says this:

"In one study in vivo , subjects were given isotopically labelled fatty acids, and biopsies of different depots were taken at abdominal surgery 24 h later (Marin et al. 1992); accumulation of label was most marked (per g TG) in the omental and retroperitoneal depots."


which used real live humans in a tracer study coupled with adipose tissue biopsies during abdominal surgery. My sort of study. Just from the abstract we have, in-vivo:

"Adipose tissue lipid uptake, measured after oral administration of labeled oleic acid in triglyceride, was approximately 50% higher in omental than in subcutaneous adipose tissues."

and in vitro

"Adipocytes from omental fat also showed a higher lipolytic sensitivity and responsiveness to catecholamines"

So, easy in via insulin, easy out via sympathetic nervous system stimulation.

But also:

"Furthermore, these adipocytes were less sensitive to the antilipolytic effects of insulin."

which is illustrated like this


Here we have visceral adipocytes as black circles and SC adipocytes as open circles. It's true that visceral adipocytes exposed to noradrenalin at 10⁻⁴ mmol/l can suppress this lipolysis less effectively than SC adipocytes do but the difference is relatively small compared to the very marked extra lipolysis under noradrenalin exposure in visceral adipocytes. Visceral adipocytes *should* stay small by balancing insulin signalling against sympathetic lipolysis.

So let's summarise:

Visceral/omental adipocytes are exquisitely insulin sensitive.

They perform markedly augmented lipolysis under sympathetic stimulation.

They have mildly impaired insulin suppression of sympathetic lipolysis.

I think that sets us up to think in sensible terms about what visceral fat does and why it is associated with metabolic syndrome.

Peter

Thursday, June 29, 2023

Insulin sensitivity makes you fat. Insulin resistance makes you fat. Discuss. (02)

This is just a longevity study but it provides insight following on from my last post.


Let's just recap:


If we start in "control" state and switch to an insulin sensitising diet we have an initial sequestration of fat in to adipocytes and rapid weight gain, red bracket. As adipocytes distend they increase their basal lipolysis, which cannot be suppressed by insulin, and both fasting insulin and post prandial insulin levels must rise. If we fail to observe the initial acute insulin sensitivity phase and limit our observations to the rising insulin resistance phase (blue bracket) we could easily observe that elevated insulin levels are *associated* with future weight gain and assume, incorrectly, that there is causality.

On to the study.

The fat in the control diet is 15% soybean oil, so approx 7% of energy intake as LA. This is not a particularly low LA diet and, as you would expect, fasting insulin levels slowly rise throughout life.

All of the following graphs are extracted from Figure 2 section J, which looks like this


giving this as the control insulin levels:


The high fat (aka insulin sensitising, aka increased LA) diet substituted lard for some of the carbohydrate and was fed ad lib. We don't know how much LA was in the lard, but probably at least 10% of the lard calories were LA. We miss the insulin sensitising hypoinsulinaemic phase as it's long gone by 28 weeks of age:


If we take this graph at face value, at any given age the insulin value is higher in the rats which are fattest, so the logical assumption is that this is causal. QED.

EDIT: I have used my imagination to butcher the above graph back to week eight. Accept or reject at your own discretion!


END EDIT.

But my contention is that these insulin levels are only elevated as a consequence of adipocyte size, ie the hyperinsulinaemia is a secondary phenomenon and could be eliminated by suppressing basal lipolysis, usually using good old acipimox. It works.

But acipimox cannot maintain suppressed lipolysis from distended adipocytes for more than a few hours.

Undoubtedly the most effective way of limiting basal lipolysis is to limit absolute adipocyte size. If we could maintain the adipocytes of the rats fed the insulin sensitising diet at the same size as those of the control fed rats there would be no "masking" effect of elevated basal lipolysis to hide the on going life long insulin sensitising effect of the obesogenic diet.

So they pair fed, by calories, exactly the same "calories" to a third group of rats so that they received exactly the same calories of insulin sensitising food as the chow fed mice eating ad lib.

These rats dis not become fat (I know, I know, heavy calories vs light calories, forgive me) and their weights exactly matched those of the control rats. So now we have rats with normal levels of basal lipolysis for age but no excess through eliminating "over eating" (stop sniggering) the amount of food which hunger, driven by excess insulin sensitivity, demanded in the "green-line" rats.

So the red line is the true insulin sensitivity of rats fed the obesogenic diet when not allowed to superimpose the increased basal lipolysis generated by becoming fat per se:


I hope this post complements the previous post and makes it completely clear that an insulin sensitising diet causes rapid sequestration of fat in to adipocytes. This lost fat will a) make you hungry, b) distend your adipocytes, c) increase their basal lipolysis and d) this latter will cause systemic insulin resistance.

This is a very basic and very simple to understand concept.

Aside: d) is core to limiting caloric ingress to cells when FFAs are available in the presence of insulin/glucose, which should not occur. You know, as in


which is a fundamental paper for understanding hyperinsulinaemia. Ignore at your peril. End aside.

What happens to make adipocytes insulin resistant (a late change in the words of Bill Lagakos, and I agree) is much, much trickier and then we're slipping in to Nick Lane territory.

Peter

Wednesday, June 28, 2023

Insulin sensitivity makes you fat. Insulin resistance makes you fat. Discuss.

My apologies for disappearing off of the blog, after the trip to Alicante and subsequent half term I got out of the habit of blogging and let the fructose thread go cold. I'll get back to it at some stage but this is what is currently making me think. Here we go.


I have a certain specific outlook on life which suggests that insulin sensitivity facilitates fat storage and insulin resistance limits fat storage.

The two anchor points to this world view are here


I think it is fairly reasonable to suggest that this is not a particularly popular point of view and that it may simply reflect my personal biases and my very selective view of the literature. While there are rodent data to support it, the overwhelming evidence from human studies is that insulin resistance/fasting hyperinsulinaemia are strongly associated with future weight gain. I'll cite the below study (let's call it the Odeleye study after the first author) in particular as it too is derived from the Pima Indians and actually mentions the second of my two anchor studies, link courtesy of Gabor Erdosi via Twitter

Fasting Hyperinsulinemia Is a Predictor of Increased Body Weight Gain and Obesity in Pima Indian Children

This is merely the tip of the iceberg and Gabor has many, many studies which show exactly the same finding. I'll stick a list of them down at the end of this post but we only need one for the purpose of my current discussion, the others give a flavour of how universal the finding is. I've not read all of Gabor's links but the titles alone give you the basic gist of their findings. I chose the Odeleye example as it's a Pima study contradicting my own favourite Pima study. It also leads us on to ventromedial hypothalamic lesions in rats, which I like. And the authors are a bit dodgy, which I also like. But there is a vast literature supporting their findings.

So here is the paradox:

Protons says:

Excessive insulin sensitivity facilitates excessive fat storage

and conventional wisdom says:

Insulin resistance makes you hyperinsulinaemic and this hyperinsulinaemia overcomes insulin resistance to facilitate excessive fat storage.

If we set this up as a simple dichotomy and assess evidence by the kilogram (once upon a time studies were published in *paper* journals. Getting a copy involved going to a library and paying 10p a page to photocopy them. You could assess likelihood of Truth by the weight of the paper used to publish. The "weight" of the evidence... Showing my age here) then clearly insulin resistance precedes weight gain. All one needs is insulin hypersecretion to overcome insulin resistance and you have obesity.

How does one tease out the explanation, especially when both directly contradictory concepts have the potential to be correct?

Let's go to the Odeleye Pima study and see what we can find. Here is this line in their discussion:

"However, our results are in contradiction to those obtained in adult Pima Indians in whom insulin resistance and high insulin secretion were associated with a lower weight gain (7,8). Reasons for the discrepant results among studies in children and adults remain to be clarified."

which is as true today as it was in 1997.

In rodent derived support of their findings in Pima children they mention

"These results [in Pima children] are consistent with those in animal studies in which hyperinsulinemia precedes an increase in body weight. In rats, lesions of the ventromedial hypothalamus result in hyperinsulinemia before excess weight accumulation (26)."

giving us, as ref 26, this study:

Unfortunately this study says nothing of the sort. From the abstract 

"One week after the lesions, total glucose metabolism was more sensitive and responsive to insulin than in age-matched controls."

and from the discussion

"Thus, for a similar increase in plasma insulin levels (i.e., +100μU/ml over basal insulinemia) VMH-lesioned rats actually showed a 92% reduction on hepatic glucose production, while such percentage inhibition was only 46% in control rats (Fig. 1)."

Aside: Also, by six weeks this enhanced ability to suppress hepatic glucose output of week one was severely compromised in the VHM rats. Secondary to adipocyte distension and increased FFA release in my opinion. It is essential to distinguish primary from secondary effects. End aside.

and from Table 1 we have


This is the best rodent study that Odeleye's group could find. I'm afraid their contention that hyperinsulinaemia precedes weight gain is simply not supported by the study they provide. Fasting insulin of 111μU/ml is neither biologically nor statistically different from 94μU/ml.


which was available at the time and is even less supportive of their statement


but they didn't. I said they were a bit dodgy! Made me giggle anyway.

There are a number of other fascinating snippets in the rodent studies but I'm wandering and so will try to get back on topic.

Just before I move on to what is actually happening I'd like to throw in the insulin section of Figure 1 from my first anchor study. Pre-obese people are particularly insulin sensitive. I've always cited Table 2 which has HOMA-IR scores to show this. It is quite possible to argue that these fasting data do not represent the dynamic effect on insulin levels in the period after a meal and that post prandial hyperinsulinaemia could easily negate the effect of the fasting values. Luckily for my position the study also fed a mixed meal and tracked insulin levels for six hours following the meal. Like this:


The pre-obese, excessively insulin sensitive people are consistently and significantly hypoinsulinaemic cf controls for at least six hours after a mixed meal. Nice.

Summary:

People at significant risk of obesity are consistently hypoinsulinaemic cf controls, in both fasting and post prandial states.

You can model this by inducing an hypothalamic lesion in rats.

You can model it by high level neonatal MSG exposure in rats

You can model it by the feeding of linoleic acid in rats.

What's happening?

This is my summary:


The time scale might be in weeks for a rodent model changed from chow to a high linoleic acid diet or years for an human neonate given his first bottle of soybean oil based infant formula soon after birth. The intervention might be even further back if his mother has been heeding a cardiologist's advice to limit saturated fats and substitute with polyunsaturates.

Okay, that's really the end of the post but here are those human observational studies. My assumption is that they are *all* observing the blue bracketed section of the graph labelled "Slowing weight gain".

I have absolutely no doubt that their data are accurately reported. I have serious doubts that any of the authors could explain the left hand end of my graphic. Which is also correctly describing reality. Any hypothesis must explain all the data. Both aspects are correct.

All links via Gabor, much appreciated.

Insulin resistance as a modifier of the relationship between dietary fat intake and weight gain _ International Journal of Obesity

Long-Term Change in both Dietary Insulinemic and Inflammatory Potential Is Associated with Weight Gain in Adult Women and Men

A longitudinal study of serum insulin and insulin resistance as predictors of weight and body fat gain in African American and Caucasian children

Ten-year weight gain is associated with elevated fasting insulin levels and precedes glucose elevation

Pre-teen insulin resistance predicts weight gain, impaired fasting glucose, and type 2 diabetes at age 18–19 y: a 10-y prospective study of black and white girls

Acute Postchallenge Hyperinsulinemia Predicts Weight Gain: A Prospective Study

Long-Term Change in both Dietary Insulinemic and Inflammatory Potential Is Associated with Weight Gain in Adult Women and Men

Insulin resistance as a modifier of the relationship between dietary fat intake and weight gain

Peter